
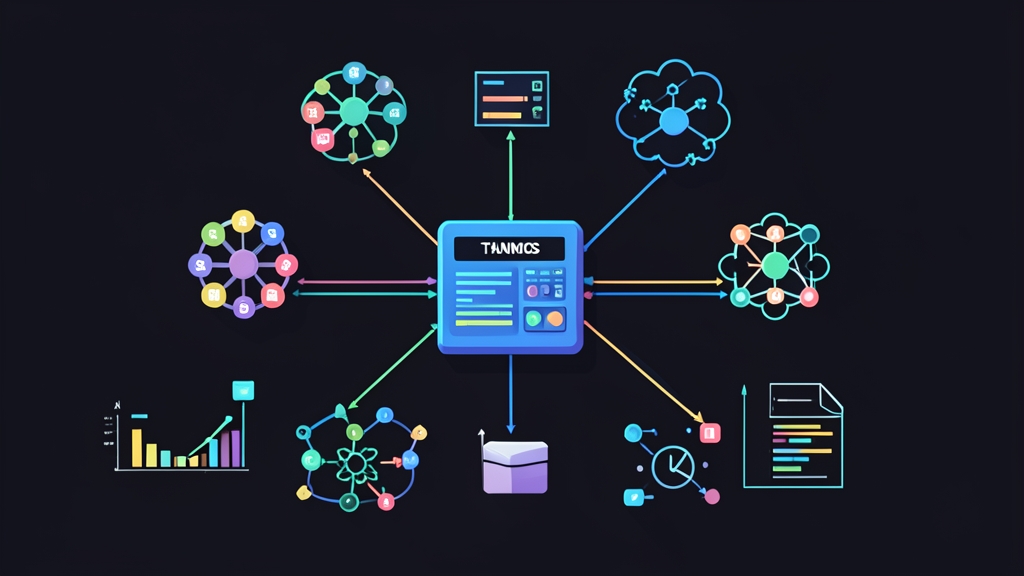
Quick Start — Get Thanos Running in 5 Minutes
Running Prometheus across multiple Kubernetes clusters is easy. Running it reliably, with months of historical data and a single query endpoint that spans all clusters — that’s where most teams hit a wall. Thanos solves exactly this. I’ve used it in production environments where metric retention went from 15 days (Prometheus’s default) to 13+ months without adding a single GB to any cluster’s local storage.
Before anything else, you need a Prometheus instance already running in your cluster. If you have that, adding Thanos is surprisingly lightweight. Start with the Sidecar — a container that runs alongside your Prometheus pod:
containers:
  - name: prometheus
    image: prom/prometheus:v2.47.0
    args:
      - --storage.tsdb.min-block-duration=2h
      - --storage.tsdb.max-block-duration=2h
      - --web.enable-lifecycle
  - name: thanos-sidecar
    image: quay.io/thanos/thanos:v0.35.0
    args:
      - sidecar
      - --tsdb.path=/prometheus
      - --prometheus.url=http://localhost:9090
      - --grpc-address=0.0.0.0:10901
      - --http-address=0.0.0.0:10902
      - --objstore.config-file=/etc/thanos/objstore.yaml
    volumeMounts:
      - name: prometheus-data
        mountPath: /prometheus
      - name: thanos-objstore-config
        mountPath: /etc/thanos
Setting both min-block-duration and max-block-duration to 2h is intentional. It tells Prometheus to stop compacting blocks itself, handing that job to Thanos Compactor. Many guides skip this setting. Don’t.
Deep Dive — The Thanos Architecture You Actually Need to Understand
Thanos is a set of components, not a single binary. Each has a specific job. Skip that mental model and you’ll spend hours debugging symptoms instead of causes.
The Sidecar — Your Bridge to Object Storage
The Sidecar runs next to each Prometheus instance. It does two things: exposes Prometheus data over gRPC so the Querier can reach it, and ships completed 2-hour TSDB blocks to your object storage bucket. Configure your object storage backend in a separate secret:
type: S3
config:
  bucket: my-thanos-metrics
  endpoint: s3.amazonaws.com
  region: ap-northeast-1
  access_key: AKIAIOSFODNN7EXAMPLE
  secret_key: wJalrXUtnFEMI/K7MDENG/bPxRfiCYEXAMPLEKEY
Thanos supports S3, GCS, Azure Blob, and MinIO. For self-hosted setups, MinIO is the go-to choice — it speaks the S3 API and runs in Kubernetes with minimal overhead.
The Store Gateway — Reading from Object Storage
Once your blocks land in object storage, the Store Gateway makes them queryable again. Deploy it as a separate Deployment:
thanos store \
  --data-dir=/var/thanos/store \
  --grpc-address=0.0.0.0:10901 \
  --http-address=0.0.0.0:10902 \
  --objstore.config-file=/etc/thanos/objstore.yaml
The Store Gateway downloads block index files locally and streams metric data on demand. It doesn’t load everything into memory — it fetches chunks lazily. For large buckets with years of data, give it an SSD-backed PVC for the index cache. This one change cut our query times from 12 seconds to under 2 seconds on 6-month range queries.
The Querier — Your Single Query Endpoint
This is the component users interact with. It acts like a Prometheus-compatible API but fans out queries to all your Sidecars and Store Gateways, then deduplicates the results:
thanos query \
  --http-address=0.0.0.0:9090 \
  --grpc-address=0.0.0.0:10901 \
  --query.replica-label=prometheus_replica \
  --store=thanos-sidecar-cluster-a:10901 \
  --store=thanos-sidecar-cluster-b:10901 \
  --store=thanos-store-gateway:10901
Point Grafana at the Querier’s HTTP port. Your dashboards now pull from multiple clusters and from object storage through one URL — no cluster-switching, no juggling separate data sources per cluster.
The Compactor — Managing Your Object Storage Efficiently
Without the Compactor, your object storage fills up with thousands of small 2-hour blocks. The Compactor merges them into larger blocks (6h, 2d, then 2w) and applies downsampling for older data:
thanos compact \
  --data-dir=/var/thanos/compact \
  --objstore.config-file=/etc/thanos/objstore.yaml \
  --retention.resolution-raw=30d \
  --retention.resolution-5m=90d \
  --retention.resolution-1h=1y \
  --wait
Run this as a single-replica Deployment — never scale it beyond 1, it doesn’t support concurrent access to the same bucket. The retention flags above keep raw data for 30 days, 5-minute downsamples for 90 days, and 1-hour downsamples for a full year. Querying a year of data at 1h resolution is fast and cheap.
Advanced Usage — Multi-Cluster Federation at Scale
Service Discovery with DNS SD
Hardcoding Sidecar addresses in the Querier works fine for two clusters. For five or more, use DNS-based service discovery. Create a headless Service for your Sidecars, then point Thanos at the DNS name:
thanos query \
  --store=dnssrv+_grpc._tcp.thanos-sidecar.monitoring.svc.cluster.local \
  --store=thanos-store-gateway.monitoring.svc.cluster.local:10901
For cross-cluster discovery, run a Thanos Querier per cluster, then point a top-level Querier at all of them. That’s the Query Frontend pattern. It adds caching and query splitting on top:
thanos query-frontend \
  --http-address=0.0.0.0:9090 \
  --query-frontend.downstream-url=http://thanos-querier:9090 \
  --query-range.split-interval=24h \
  --query-range.max-retries-per-request=5 \
  --cache-compression-type=snappy
The Query Frontend splits long-range queries into 24-hour chunks and caches each chunk independently. A dashboard loading 30 days of data goes from one slow query to 30 parallel cacheable queries.
Ruler — Alerting and Recording Rules That Span Clusters
One thing Prometheus can’t do natively is evaluate a recording rule that references metrics from two different clusters. Thanos Ruler can:
apiVersion: v1
kind: ConfigMap
metadata:
  name: thanos-ruler-rules
data:
  rules.yaml: |
    groups:
      - name: cross-cluster
        interval: 1m
        rules:
          - record: job:http_requests:rate5m
            expr: sum(rate(http_requests_total[5m])) by (job, cluster)
Ruler queries the Querier — which sees all clusters at once — and writes results back to object storage as new TSDB blocks. Each cluster stays oblivious to the others. The global view lives entirely in the Ruler.
Practical Tips From the Field
Label Your Clusters — Everything Depends on It
Add an external label to each Prometheus instance. Without this, deduplication breaks and you’ll see duplicate time series in your queries:
global:
  external_labels:
    cluster: production-ap-northeast-1
    region: ap-northeast-1
Teams that skip external labels spend days debugging why their request count graphs show double the real traffic. I’ve watched this happen on three separate cluster migrations.
Watch Your Object Storage Costs
Thanos uploads every 2-hour block. For a cluster scraping 100k time series at 15-second intervals, you’re looking at roughly 500MB per day before compression. Enable compression at the bucket level — S3 doesn’t compress objects by default. Also watch your LIST API calls. The Store Gateway hammers them on startup and during queries, and LIST operations on S3 aren’t free.
A simple cost check: list your bucket structure to see block accumulation:
# Check how many blocks exist and their sizes
aws s3 ls s3://my-thanos-metrics/ --recursive --human-readable | \
  awk '{print $3, $4}' | \
  tail -20

# Count total blocks
aws s3 ls s3://my-thanos-metrics/ | wc -l
Tune the Store Gateway Cache
The Store Gateway’s default in-memory index cache is 250MB. For buckets with more than a few months of data, bump it up:
thanos store \
  --index-cache-size=1GB \
  --chunk-pool-size=2GB \
  --store.grpc.series-max-concurrency=20
Alternatively, plug in a Redis or Memcached instance as a shared cache. It makes a real difference when multiple engineers query the same time range simultaneously — without it, every pod fetches the same index data from object storage independently.
Monitor Thanos Itself
Thanos exposes Prometheus metrics at /metrics on each component’s HTTP port. The metrics you actually want to watch:
thanos_compact_group_compactions_total— compaction healththanos_store_bucket_operations_total— object storage API call ratethanos_query_concurrent_gate_queries_in_flight— query load on the Querierthanos_sidecar_prometheus_up— Sidecar can reach its Prometheus (should always be 1)
A quick sanity check that your blocks are being shipped correctly:
kubectl logs deployment/prometheus -c thanos-sidecar | grep -i "uploaded"
# Expected output:
# level=info msg="uploaded block" id=01HXYZ... duration=2.3s
If upload logs aren’t appearing every 2 hours, check your TSDB block duration settings first, then verify the Sidecar’s object storage credentials.
Once you’re past one cluster, or once retention requirements stretch beyond a few weeks, Thanos stops feeling like overhead. Another cluster? One more Sidecar and one more --store flag. More read throughput? Add Store Gateways. The Querier fans out automatically — you don’t touch anything else.