
Real-World Problem: Telemetry Sprawl and Vendor Lock-in in Kubernetes
Most production Kubernetes clusters start lean. You deploy three microservices, scrape metrics with Prometheus, tail container logs via Fluent Bit, and embed a SaaS APM agent for tracing. It works well at first. Then the platform expands.
Within a year, those three services multiply into 40 distinct deployments spanning eight namespaces on 20 worker nodes. Agent bloat quickly sets in. Each worker node ends up running three or four sidecars and daemon agents, collectively eating 1.5 to 2.5 GB of node RAM just shipping telemetry.
When security requires masking credit card numbers from logs before transmission, you discover that every logging daemon demands a different proprietary regex dialect. Worse, evaluating an alternative platform to slash a $15,000 monthly monitoring bill requires modifying SDKs across dozens of application repositories.
That sprawl triggers three costly bottlenecks: wasted node capacity, hundreds of dollars in cross-AZ egress fees from redundant telemetry streams, and complete vendor lock-in.
Root Cause Analysis: Direct-to-Backend Tight Coupling
Why do engineering teams hit this wall? The core problem is tight coupling between the workloads producing telemetry and the platforms consuming it.
When microservices send data directly to external endpoints, infrastructure plumbing pollutes application logic. An application should only record business events and emit telemetry signals. It should not handle gzip compression, backoff retries, batch buffers, or Kubernetes metadata enrichment.
Without an in-cluster routing layer, teams face three major technical hurdles:
- Incompatible data formats: Metrics, traces, and logs use divergent naming conventions (such as
service_nameversusservice.name), breaking correlation during incidents. - Zero edge data hygiene: Dropping noisy
/healthzspans or masking PII requires either code changes in every service or expensive ingest-time processing rules at your monitoring provider. - Connection churn and overhead: Hundreds of application pods establish separate outbound TLS connections, exhausting NAT gateway connection limits and racking up inter-zone egress charges.
Architecture Comparison: Three Ingestion Strategies
Before writing manifests, evaluate the three common architectures for managing Kubernetes telemetry.
1. Direct In-App Exporters
Every application pod embeds a proprietary vendor SDK and transmits data directly to external SaaS endpoints like Datadog, New Relic, or Dynatrace.
- Pros: Fast initial setup for early proof-of-concept services.
- Cons: Severe vendor lock-in, zero centralized governance, and 50–100 MB of extra memory consumed per pod runtime.
2. Fragmented Point Agents (Prometheus + Fluent Bit + Jaeger Agent)
Teams run separate, specialized open-source daemons on each node for each telemetry type.
- Pros: Mature, battle-tested tools with extensive documentation.
- Cons: Three separate configuration formats, three daemon upgrade cycles, and no unified trace-to-log context correlation.
3. OpenTelemetry Collector (Unified Gateway & Pipeline)
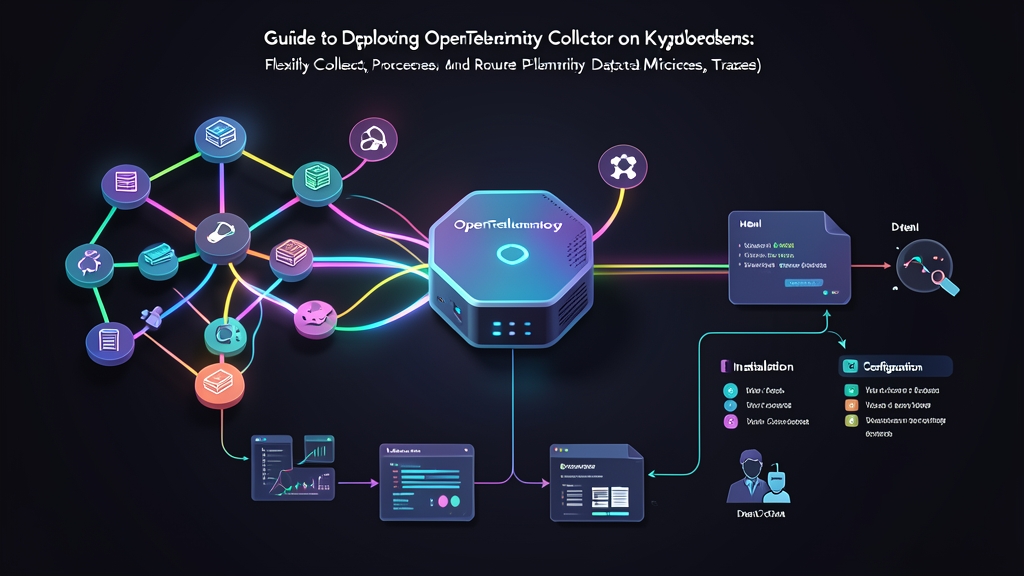
A single vendor-neutral proxy accepts telemetry over open standards (OTLP, Prometheus, Zipkin), processes it in memory, and fans it out to any storage engine.
- Pros: One unified YAML pipeline, automatic Kubernetes pod attribute injection, centralized sampling, and instant backend switching without code updates.
- Cons: Requires learning the Collector pipeline syntax and properly tuning memory limiter thresholds.
Recommended Pattern: Two-Tier Agent and Gateway Topology
For production Kubernetes environments, a two-tier hybrid architecture delivers the best balance of performance and control.
Run a lightweight DaemonSet on each node to scrape local cgroup metrics and tail container log files from /var/log/pods. This node agent routes all data over local gRPC to an autoscaling Deployment running as a centralized Gateway. The Gateway handles heavy workloads: querying the Kubernetes API server for pod metadata, applying tail-based sampling, filtering PII, and routing to external backends.
Step 1: Add the OpenTelemetry Helm Repository
Use the official OpenTelemetry Helm chart to maintain repeatable, declarative deployments across environments:
helm repo add open-telemetry https://open-telemetry.github.io/opentelemetry-helm-charts
helm repo update
Step 2: Configure the Collector Pipeline
Create a customized otel-collector-values.yaml file. The collector pipeline organizes data processing into four components: receivers (how data arrives), processors (in-memory transformation and batching), exporters (destination backends), and service pipelines (wiring components together).
mode: "deployment"
replicaCount: 2

resources:
  limits:
    cpu: 1000m
    memory: 1Gi
  requests:
    cpu: 250m
    memory: 512Mi

config:
  receivers:
    otlp:
      protocols:
        grpc:
          endpoint: 0.0.0.0:4317
        http:
          endpoint: 0.0.0.0:4318

  processors:
    memory_limiter:
      check_interval: 1s
      limit_percentage: 75
      spike_limit_percentage: 20

    batch:
      send_batch_size: 8192
      timeout: 1s

    k8sattributes:
      auth_type: "serviceAccount"
      passthrough: false
      extract:
        metadata:
          - k8s.pod.name
          - k8s.pod.uid
          - k8s.namespace.name
          - k8s.node.name
          - k8s.deployment.name
      pod_association:
        - sources:
            - type: ip

  exporters:
    debug:
      verbosity: basic
    otlp/jaeger:
      endpoint: "jaeger-collector.observability.svc.cluster.local:4317"
      tls:
        insecure: true
    prometheus:
      endpoint: "0.0.0.0:8889"
      namespace: "otel"

  service:
    pipelines:
      traces:
        receivers: [otlp]
        processors: [memory_limiter, k8sattributes, batch]
        exporters: [otlp/jaeger, debug]
      metrics:
        receivers: [otlp]
        processors: [memory_limiter, k8sattributes, batch]
        exporters: [prometheus]
      logs:
        receivers: [otlp]
        processors: [memory_limiter, k8sattributes, batch]
        exporters: [debug]
Notice the placement of memory_limiter as the very first processor in each pipeline. Placing it first ensures the collector sheds load before consuming excess memory and triggering a Kubernetes OOMKill event.
Step 3: Deploy the Gateway to Kubernetes
Create an observability namespace and install the Helm chart with your configuration:
kubectl create namespace observability

helm upgrade --install otel-collector open-telemetry/opentelemetry-collector \
  --namespace observability \
  -f otel-collector-values.yaml
Confirm the Gateway pods are running and the internal service is accessible:
kubectl get pods -n observability -l app.kubernetes.io/name=opentelemetry-collector
kubectl get svc -n observability otel-collector
Step 4: Configure Workloads with Standard OTLP Variables
Because the collector accepts vendor-agnostic OTLP payloads, instrumenting your workloads requires zero vendor-specific code. Inject standard OpenTelemetry environment variables directly into your pod specification:
apiVersion: apps/v1
kind: Deployment
metadata:
  name: order-service
  namespace: default
spec:
  replicas: 2
  selector:
    matchLabels:
      app: order-service
  template:
    metadata:
      labels:
        app: order-service
    spec:
      containers:
        - name: app
          image: mycompany/order-service:1.2.0
          env:
            - name: OTEL_EXPORTER_OTLP_ENDPOINT
              value: "http://otel-collector.observability.svc.cluster.local:4317"
            - name: OTEL_EXPORTER_OTLP_PROTOCOL
              value: "grpc"
            - name: OTEL_SERVICE_NAME
              value: "order-service"
            - name: OTEL_RESOURCE_ATTRIBUTES
              value: "deployment.environment=production,service.version=1.2.0"
Step 5: Validate Data Ingestion and Metadata Enrichment
Stream the collector pod logs to verify that traces, metrics, and logs pass through the processor pipeline:
kubectl logs -n observability -l app.kubernetes.io/name=opentelemetry-collector -f --tail=50You should see incoming spans decorated with k8s.pod.name, k8s.namespace.name, and service.version. When business requirements shift, switching destinations—from Jaeger to Grafana Tempo, or Prometheus to Datadog—only requires updating your exporter configuration. Your application deployments remain untouched.