
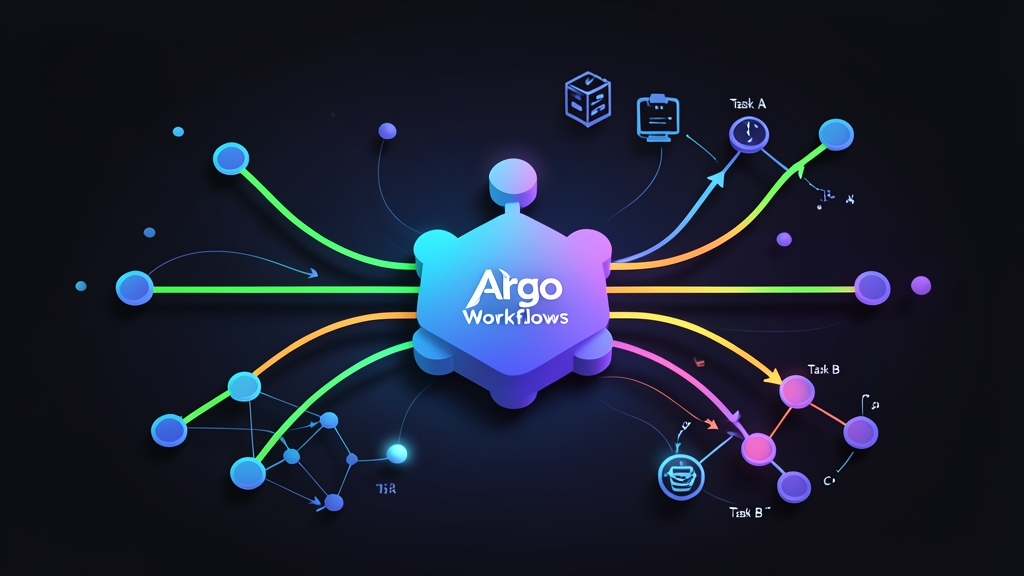
Context & Why: Moving Beyond CronJobs and Heavy CI Engines
Most engineering teams start batch processing the simple way: standard Kubernetes CronJob manifests or dedicated Jenkins jobs. This setup holds up fine for running a 2 a.m. database vacuum or triggering single-step syncs. Once your pipelines split into multi-stage ETLs, however, things get messy fast.
Kubernetes CronJobs run single pods in isolation. They have zero awareness of upstream or downstream task dependencies. If task B needs task A to succeed first, or if task C must wait on 20 parallel worker pods, CronJobs leave you stranded.
You end up hacking together Redis lock scripts, polling loops, and brittle webhook callbacks. Pushing these data workloads onto Jenkins or GitLab CI is not much better. Jenkins JVM runners often consume 2 to 4 GB of RAM just sitting idle, and coordinating dynamic Kubernetes agents frequently triggers plugin sync failures and runaway node pools.
Argo Workflows replaces these workarounds with native Kubernetes Custom Resource Definitions (CRDs). Every step in your pipeline runs as a standalone pod. When a step finishes, its container exits immediately, freeing up CPU and memory for other workloads.
Workflows are declared as Directed Acyclic Graphs (DAGs). This lets independent branches run concurrently without external locks. In our production migration across 40 daily batch jobs, this model cut cluster compute costs by roughly 35% and dropped our nightly ETL run time from 3.5 hours to 50 minutes.
Installation: Setting Up Argo Workflows the Right Way
You will need a functioning Kubernetes cluster (v1.26 or newer) and kubectl with cluster-admin rights.
1. Create Namespace and Deploy Core Resources
Isolate the workflow controller and its supporting services in their own namespace. Deploy the controller, UI server, and required CRDs using the official manifest:
# Create a dedicated namespace
kubectl create namespace argo

# Deploy Argo Workflows controller, UI server, and CRDs
kubectl apply -n argo -f https://github.com/argoproj/argo-workflows/releases/download/v3.5.5/quick-start-minimal.yaml
2. Configure RBAC Permissions for Pipeline Pods
Workflow steps run as pods, and those pods need permission to report their status back to the workflow controller. The default service account lacks these privileges. Create a dedicated service account and bind it to appropriate permissions in your target namespace:
kubectl create serviceaccount argo-runner -n default

kubectl create rolebinding argo-runner-admin \
  --clusterrole=admin \
  --serviceaccount=default:argo-runner \
  --namespace=default
Using admin works well for testing. In locked-down production clusters, replace it with a least-privilege Role that only grants access to necessary ConfigMaps, Secrets, and Pod artifacts.
3. Install the Argo CLI
You can inspect workflows with kubectl get wf, but the dedicated Argo CLI makes debugging much simpler. It supports live log streaming, artifact inspection, and visual ASCII graphs in your shell:
# Download the Linux x86_64 binary
curl -sLO https://github.com/argoproj/argo-workflows/releases/download/v3.5.5/argo-linux-amd64.gz

# Decompress and install to PATH
gunzip argo-linux-amd64.gz
chmod +x argo-linux-amd64
sudo mv argo-linux-amd64 /usr/local/bin/argo

# Verify installation
argo version --short
Configuration: Designing Parallel DAG Pipelines
Sequential pipelines waste compute. In a DAG workflow, non-dependent steps trigger the moment their inputs become available, distributing heavy computations across all ready cluster nodes.
Defining a Production DAG Workflow
Save this manifest as parallel-dag-pipeline.yaml. It pulls raw records, fans out into two parallel analytics workers, and merges the computed outputs into a final summary step:
apiVersion: argoproj.io/v1alpha1
kind: Workflow
metadata:
  generateName: distributed-analytics-dag-
  namespace: default
spec:
  entrypoint: analytics-pipeline
  serviceAccountName: argo-runner
  templates:
  - name: analytics-pipeline
    dag:
      tasks:
      - name: fetch-raw-data
        template: data-fetcher

      # Parallel Step A: Triggers as soon as raw data is ready
      - name: compute-user-metrics
        dependencies: [fetch-raw-data]
        template: processor
        arguments:
          parameters:
          - name: job-type
            value: "user-metrics"

      # Parallel Step B: Runs side-by-side with Step A
      - name: compute-billing-metrics
        dependencies: [fetch-raw-data]
        template: processor
        arguments:
          parameters:
          - name: job-type
            value: "billing-metrics"

      # Aggregation Step: Blocks until both workers finish
      - name: generate-summary-report
        dependencies: [compute-user-metrics, compute-billing-metrics]
        template: reporter

  # Task Templates
  - name: data-fetcher
    container:
      image: alpine:3.19
      command: [sh, -c]
      args: ["echo 'Fetching database dumps...' && sleep 5 && echo 'Raw data staging completed.'"]

  - name: processor
    inputs:
      parameters:
      - name: job-type
    container:
      image: python:3.11-alpine
      command: [python, -c]
      args:
      - |
        import sys, time
        job = "{{inputs.parameters.job-type}}"
        print(f"Processing partition for: {job}")
        time.sleep(8)
        print(f"Finished analytics partition: {job}")

  - name: reporter
    container:
      image: alpine:3.19
      command: [sh, -c]
      args: ["echo 'Consolidating outputs from parallel workers...' && echo 'Pipeline completed successfully.'"]
Submitting and Managing the Pipeline
Trigger the workflow using the Argo CLI with live log streaming enabled:
argo submit -n default --watch parallel-dag-pipeline.yaml
Notice the execution graph in your terminal. As soon as fetch-raw-data completes, the controller spins up compute-user-metrics and compute-billing-metrics simultaneously. If you run a cluster autoscaler like Karpenter, these pods trigger node scaling on demand and tear down nodes once the workload ends.
Verification & Monitoring: Operating Workflows with Confidence
Pipelines will eventually fail due to bad upstream data or network timeouts. Solid visibility makes the difference between a five-minute fix and a two-hour outage.
1. Accessing the Web Dashboard
Argo includes a clean web UI for inspecting task graphs and pod logs. Forward port 2746 to your workstation:
kubectl port-forward -n argo svc/argo-server 2746:2746
Open https://localhost:2746 in your browser. Accept the self-signed certificate if prompted. The dashboard renders your execution graph in real time, displays container exit codes, and provides one-click resubmissions for failed steps.
2. Command-Line Status Inspection
When operating over a bastion host or writing alerting scripts, inspect your pipeline status directly through the CLI:
# List the latest pipeline runs and their execution states
argo list -n default

# View detailed timing, step status, and pod IDs
argo get -n default @latest

# Stream logs from a specific container in the DAG
argo logs -n default @latest -c processor
3. Production Checklist
- Configure Pod Garbage Collection: Add
podGC.strategy: OnWorkflowCompletionto your workflow spec. Retaining thousands of completed pods bloats etcd storage and slows down your API server. - Set Explicit Resource Bounds: Always declare
requestsandlimitsfor memory and CPU on each template. Without limits, a sudden fan-out of 50 tasks can starve critical system pods like CoreDNS. - Use Retry Policies for Flaky Steps: Attach a
retryStrategywith an exponential backoff to network-dependent steps. A transient 503 response from an external API should not abort a 40-minute pipeline.