The Silent Failure Problem in Self-Hosted Setups
Six months ago, my self-hosted Nextcloud instance died on a Friday afternoon while I was away. Nobody noticed. Ten hours passed before someone tried syncing a client folder and hit a wall. A routine OS package upgrade had silently hung the MariaDB container. Meanwhile, Nginx kept happily serving empty 502 Bad Gateway pages.
Silent failures are the bane of any homelabber running dozens of containers across mini-PCs and hypervisors. Dashboards like Homer or Dashy provide pretty application bookmarks. They will not tell you when a database deadlocks, an internal worker crashes, or an SSL certificate expires next Tuesday. Cloud monitors like Better Stack or UptimeRobot work great for public domains. They cannot touch private subnets like 192.168.1.50:8080 without punching messy holes through your firewall.
I needed an internal watchdog. It had to live inside my LAN, poll key services every 60 seconds, and ping my phone before users started complaining.
Core Concepts: How Uptime Kuma Works
Uptime Kuma is an open-source monitoring tool built on Node.js and Vue 3. Enterprise observability stacks like Prometheus and Grafana demand dedicated storage and noticeable CPU cycles. In contrast, Kuma sips roughly 130MB to 180MB of RAM. It delivers sub-second dashboard updates over WebSockets without breaking a sweat on an old Intel NUC or a Raspberry Pi 4.
Monitor Types and Probing Strategies
ICMP pings only tell you if an operating system answers. They do not tell you if the app works. Uptime Kuma handles targeted probes designed for real-world homelab stacks:
- HTTP(s) Keyword Checks: Validates response codes like
200 OKand scans the HTML payload for a specific string (such asNextcloudorDashboard). This confirms the web server rendered the application instead of a blank white page or a reverse-proxy error. - TCP Port and Ping: Tracks hypervisor ports, network switches, and raw database sockets like PostgreSQL on port 5432 or Redis on 6379.
- DNS Query Monitoring: Queries local resolvers such as Pi-hole or AdGuard Home. It flags resolution failures and high response latencies exceeding 150ms.
- TLS/SSL Expiry Tracking: Parses certificate lifetimes automatically. It fires a warning 14 days before a Let’s Encrypt renewal silently slips past you.
- Push Monitors (Heartbeats): Acts as a dead-man’s switch for cron tasks and backup jobs. If your nightly Borg or Restic backup script does not curl its assigned webhook within 25 hours, Kuma raises an alarm.
Decoupled Notification Architecture
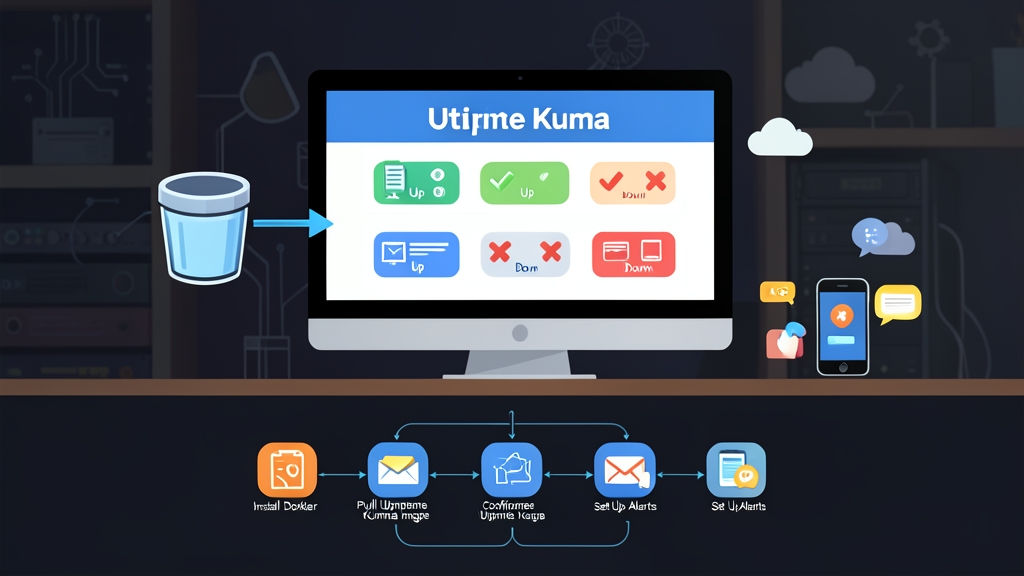
Kuma completely separates probe logic from alert routing. If an endpoint fails its retry limit, an event triggers through independent notification drivers. You can blast alerts simultaneously to Discord, Telegram, Pushover, Gotify, Signal, or generic webhooks without touching the individual monitor configurations.
Hands-on Practice: Deploying Uptime Kuma with Docker
Containerizing Uptime Kuma keeps upgrades simple and confines all state to a single directory. Here is the exact Compose setup running on my Ubuntu 24.04 server.
Step 1: Docker Compose Deployment
Set up a project directory on your Docker host and open a new configuration file:
mkdir -p /opt/uptime-kuma && cd /opt/uptime-kuma
nano docker-compose.yml
Paste the following deployment definition:
services:
  uptime-kuma:
    image: louislam/uptime-kuma:1
    container_name: uptime-kuma
    restart: always
    volumes:
      - ./kuma-data:/app/data
    ports:
      - "3001:3001"
    security_opt:
      - no-new-privileges:true
Bring the container up in detached mode:
docker compose up -d
Check the container state to ensure it started cleanly:
docker compose ps
Open your browser and navigate to http://<your-server-ip>:3001. The onboarding wizard prompts you to create an admin username and password. Submit the form to enter the main control panel.
Step 2: Configuring Monitors with Edge Validation
Avoid relying on simple HTTP status codes alone. An internal proxy like Traefik or Caddy can return a 200 OK while the downstream app container is completely dead. Use keyword validation instead.
Click Add New Monitor in the navigation header and enter these settings:
- Monitor Type: HTTP(s) – Keyword
- Friendly Name: Nextcloud Core
- URL:
https://cloud.local.internal/login - Heartbeat Interval: 60 seconds
- Retries: 2 (waits for two consecutive failed checks before alerting to absorb minor Wi-Fi drops)
- Keyword:
Nextcloud - Certificate Expiry Notification: Enabled (alerts when valid certificate life drops below 14 days)
Click Save. Kuma kicks off the initial probe immediately, updates the response latency graph, and turns the status badge green.
Step 3: Configuring Discord and Telegram Incident Alerts
A monitoring system that fails to alert you in real time is useless. Route critical failure events directly to chat platforms you monitor daily.
Go to Settings > Notifications > Setup Notification.
Option A: Telegram Bot Alerting
- Open Telegram, start a chat with
@BotFather, and run/newbotto generate your bot token. - Create an administrative channel or group, add your newly created bot as a member, and send a test message.
- Retrieve your numeric Chat ID using
@userinfobotor by curlinghttps://api.telegram.org/bot<YOUR_TOKEN>/getUpdates. - In Kuma, select Telegram, input your token and Chat ID, and click Test. Your phone should chime within two seconds.
Option B: Discord Webhook Integration
- In your Discord server, head to Server Settings > Integrations > Webhooks.
- Click New Webhook, select your target alerts channel (e.g.,
#homelab-alerts), and copy the generated Webhook URL. - In Kuma, select Discord from the notification list, paste the URL, and save.
Enable Default enabled on all existing monitors so future probes automatically inherit your notification channels.
Step 4: Publishing a Clean Status Page
Keep your family and home users informed without giving them full administrative access to your infrastructure dashboard. Kuma includes a clean, standalone status page engine.
- Click Status Pages in the top menu and select New Status Page.
- Define a clean URL slug such as
services(this generates the path/status/services). - Assign a title, upload a custom logo, and create service groups such as Media Stack (Plex, Jellyfin), Network Core (Pi-hole, Router), and Storage (TrueNAS, Nextcloud).
- Add descriptions and pin scheduled maintenance announcements whenever you plan host kernel updates or physical disk swaps.
Lessons from 6 Months of Homelab Production
My current Kuma instance actively checks 34 endpoints. Its SQLite database (./kuma-data/kuma.db) hovers around 110MB with a standard 90-day retention window. CPU load on an Intel Celeron N5105 stays under 0.5%.
A few hard-earned tuning rules worth adopting:
- Ditch 5-second polling intervals: Aggressive checks trigger false alarms during Docker garbage collection or heavy backup snapshots. A 60-second interval with 2 retries eliminates noisy pages while catching real crashes within 3 minutes.
- Automate database backups: Everything Kuma stores—including credentials, probe histories, and status configurations—lives in
kuma.db. Run a nightly rsync or Borg job on the./kuma-datafolder. - Separate uptime checks from host telemetry: Use Kuma strictly for state detection (“Is this service responding?”). Leave memory saturation, CPU spikes, and IOPS graphs to Prometheus, Netdata, or Grafana.
Taking thirty minutes to configure Docker Compose and webhook alerts will save you hours of debugging. You spot container crashes immediately, not after someone complains at dinner.