The Fragile State of Custom AI Glue Code
Six months ago, our team hit an operational wall. We were drowning in roughly 650 incoming tickets a day—spanning billing inquiries, triage requests, and critical alerts across 14 production databases. Our initial band-aid was a cluster of Python scripts deployed on AWS Lambda. They ingested webhook payloads, pinged OpenAI’s chat/completions endpoint, and pushed alert summaries into Slack.
That architecture cracked almost immediately. An unexpected upstream schema change broke json parsing.
Traffic spikes hit provider rate limits, dropping webhook callbacks into silent dead-letter queues. Worst of all, every single prompt tweak requested by our product team required code edits, local unit tests, code review, and a fresh CI/CD rollout. We evaluated Zapier and Make, but their rigid branching fell apart the moment we needed dynamic memory buffers, recursive tool calls, or parametrized PostgreSQL lookups.
We scrapped the Lambdas and migrated to a self-hosted n8n cluster. Instead of gluing separate scripts together, n8n treats language models as native workflow primitives. It gives them tool-calling primitives, short-term conversational context, and execution safeguards out of the box. Six months and 110,000 processed workflows later, here is what we discovered running production-grade AI pipelines.
Core Concepts: How n8n Orchestrates AI Agents
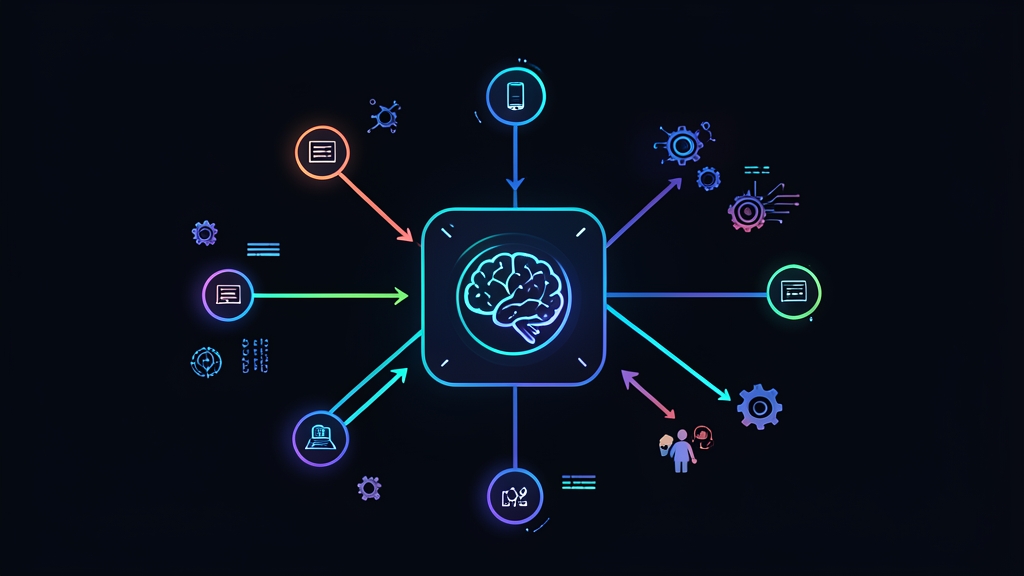
Behind the canvas, n8n leverages LangChain to manage state and execution loops. Unlike static IF/ELSE pipelines, an n8n AI workflow relies on an autonomous feedback cycle powered by four modular building blocks:
- AI Agent Node: The workflow coordinator. It receives incoming trigger data, consults system instructions, selects which tools to invoke, monitors intermediate outputs, and manages execution retries.
- Language Model Connector: The inference engine. This connects straight to providers like OpenAI, Anthropic, or local Ollama endpoints running Llama 3. Hyperparameters like temperature, top_p, and token ceilings stay cleanly isolated from your business logic.
- Memory Layer: The contextual cache. Nodes such as
Window Buffer Memorytrack state across multiple interactions, pulling conversation history without requiring manual queries against a separate Redis or Postgres table. - Tools and Sub-workflows: The execution layer. LLMs cannot read an active replica lag metric or update Jira tickets on their own. Tools bridge that gap by exposing HTTP calls, custom JavaScript logic, or entire n8n sub-workflows as callable functions.
Separating retrieval tools from prompt logic saves hours of firefighting. If you need to switch from gpt-4o to claude-3-5-sonnet, your downstream integrations remain completely untouched.
Hands-On Practice: Deploying an Incident Triage Agent
Let’s walk through our production alert triage flow. When an alert webhook fires, an AI agent parses the stack trace, queries an internal microservice for system metrics, and determines whether to wake up the on-call engineer.
Step 1: Deploying Self-Hosted n8n
Self-hosting eliminates per-execution SaaS bills and keeps sensitive customer payload data within our private VPC. Here is the trimmed docker-compose.yml running on an AWS EC2 t3.medium instance:
version: '3.8'

services:
  n8n:
    image: n8nio/n8n:latest
    restart: unless-stopped
    ports:
      - "5678:5678"
    environment:
      - N8N_HOST=n8n.internal.yourdomain.com
      - N8N_PORT=5678
      - N8N_PROTOCOL=https
      - NODE_ENV=production
      - WEBHOOK_URL=https://n8n.internal.yourdomain.com/
      - EXECUTIONS_DATA_PRUNE=true
      - EXECUTIONS_DATA_MAX_AGE=168
    volumes:
      - ./n8n_data:/home/node/.n8n
Spin up the container and verify that database migrations completed cleanly:
docker compose up -d
docker compose logs -f n8n
Step 2: Configuring the AI Agent and Model Connectors
Log into the n8n dashboard and initialize a blank workflow canvas:
- Drop in a Webhook trigger node configured for
POSTrequests at/incident-alert. - Add an AI Agent node and set the Agent mode to Tools Agent.
- Connect an OpenAI Chat Model node to the model connector input. Pick
gpt-4oand set temperature to0.1. Low temperature is critical here to keep classification deterministic. - Attach a Window Buffer Memory node to the memory input. Set the Session Key to
{{ $json.body.incident_id }}so updates to the same incident thread retain shared context.
Step 3: Equipping the Agent with Custom Tools
The agent needs live telemetry before it can make a triage decision. Connect a Custom n8n Tool node to the AI Agent’s tool port. Label it check_system_health and wire an HTTP GET request to our internal status microservice:
# Internal endpoint queried by the tool
curl -X GET https://api.internal.local/v1/health \
  -H "Authorization: Bearer srv_token_production" \
  -H "Content-Type: application/json"
Set the tool description to: “Retrieves current database connection pool utilization, CPU load averages, and active job backlogs. Call this when classifying error payloads.” The model uses this description to decide when and why to invoke the endpoint. Make it clear and concrete.
Step 4: Structuring the Output and Downstream Action
Raw LLM output can be messy. To stop conversational filler like “Here is your analysis” from crashing downstream APIs, attach an Auto-fixing Output Parser node with an explicit schema:
{
  "type": "object",
  "properties": {
    "severity": {
      "type": "string",
      "enum": ["CRITICAL", "WARNING", "INFO"]
    },
    "assigned_team": {
      "type": "string",
      "enum": ["database-infra", "frontend-core", "billing"]
    },
    "executive_summary": {
      "type": "string"
    },
    "recommended_immediate_action": {
      "type": "string"
    }
  },
  "required": ["severity", "assigned_team", "executive_summary"]
}
Pipe the output into a Switch node. If severity == 'CRITICAL', the pipeline triggers our PagerDuty rotation and posts to an urgent incident channel in Slack. Everything else routes directly to Jira Service Desk as a backlogged ticket.
Observations and Best Practices from Production
Half a year in production exposed pitfalls you will rarely encounter in local tutorials:
- Guard Against Runaway Tool Loops: During our third week, an ambiguous error log caused an agent to query our telemetry API 24 times consecutively before timing out. Set the Max Iterations field to
3or4to cut recursive loops early. - Slash Costs with Semantic Caching: Repetitive server status pings waste tokens. Placing a Redis cache node before the agent reduced our monthly OpenAI bill from $1,840 to $1,065—a 42% cost reduction without losing triage accuracy.
- Eliminate Unparsed Markdown: Language models love wrapping JSON blocks in triple backticks. If you skip output parsing, your downstream webhooks will fail on raw markdown strings.
- Aggressively Prune Run Logs: Our workflow run data consumed 38 GB of disk space in under three weeks. Setting
EXECUTIONS_DATA_PRUNE=trueand capping storage at 168 hours (7 days) prevented our Docker volumes from running out of inodes.
Moving Beyond Hand-Coded Scripts
Ditching custom script maintenance for visual, node-based orchestration cut our average incident response time from 18 minutes down to under 90 seconds. When engineering needs to adjust routing thresholds, our on-call leads can tweak prompts and test payloads directly on the canvas. Platform engineers can focus on uptime, IAM roles, and secret rotation instead of writing boilerplate API wrappers.
Low-temperature models, bounded tool iteration counts, and structured output schemas give you the analytical reasoning of an LLM while keeping your production pipelines predictable and resilient.