
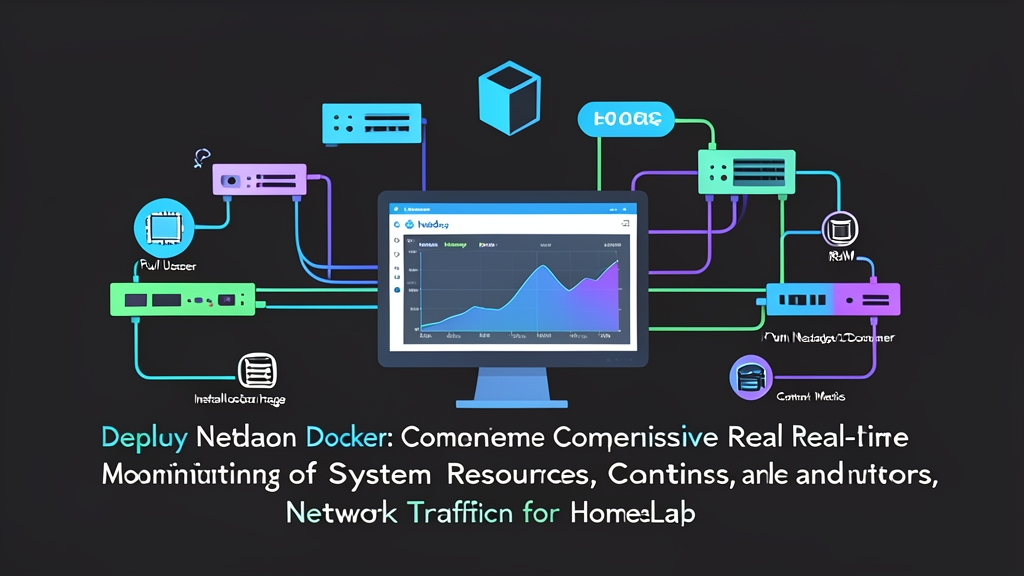
Context & Why: When You Need Answers in Seconds, Not Minutes
Running a HomeLab means you’re constantly asking the same question: why is this service slow right now? I’ve had that exact moment — a Jellyfin stream starts stuttering at 11 PM, and I need to know if it’s CPU, RAM, disk I/O, or the network — fast.
I already run the TIG Stack (Telegraf + InfluxDB + Grafana) for infrastructure metrics, and Grafana Loki for logs. Both are solid. But spinning those up takes time, and you need to build dashboards from scratch. When I add a new machine to the lab, I don’t want to configure a Telegraf agent and wire Grafana panels before I can see anything.
That’s where Netdata fits into my stack. It deploys in a single docker compose up, starts collecting metrics immediately — CPU, memory, disk, network, running containers, systemd services — and surfaces everything in a fully built dashboard at port 19999 within about 30 seconds. No schema to design, no panels to build.
Netdata also runs lean. It uses roughly 100 MB RAM and 1–2% CPU on most HomeLab machines. On a Raspberry Pi 4 running 15 containers, it barely registers.
In my real-world experience, this is one of the essential skills to master — knowing which monitoring tool fits which problem. Netdata fills the gap between “nothing” and a full observability stack. It answers the immediate question fast, while Grafana handles the long-term analysis.
Installation: Docker Compose Setup
Create a directory for Netdata and add a docker-compose.yml:
mkdir -p ~/homelab/netdata && cd ~/homelab/netdataversion: "3.8"
services:
netdata:
image: netdata/netdata:latest
container_name: netdata
hostname: homelab-monitor # Appears in the dashboard header
restart: unless-stopped
pid: host
network_mode: host # Required for real network interface metrics
cap_add:
- SYS_PTRACE
- SYS_ADMIN
security_opt:
- apparmor:unconfined
volumes:
- netdataconfig:/etc/netdata
- netdatalib:/var/lib/netdata
- netdatacache:/var/cache/netdata
- /etc/passwd:/host/etc/passwd:ro
- /etc/group:/host/etc/group:ro
- /proc:/host/proc:ro
- /sys:/host/sys:ro
- /etc/os-release:/host/etc/os-release:ro
- /var/run/docker.sock:/var/run/docker.sock:ro
volumes:
netdataconfig:
netdatalib:
netdatacache:A few things worth explaining here before you just paste and run:
pid: host— lets Netdata see all host processes. Without this, per-process CPU and memory metrics disappear.network_mode: host— without this, Netdata only sees the container’s virtual NIC, not your actualeth0,ens3, or bond interfaces./var/run/docker.sock— this is how Netdata auto-discovers your other containers and reports CPU, memory, and I/O per container, with no extra config.SYS_PTRACE— needed for eBPF-based metrics like active TCP connections and VFS operations.
Start it up and tail the logs briefly to confirm it initializes cleanly:
docker compose up -d
docker logs -f netdata   # Should be ready in under 30 seconds
Open http://<your-host-ip>:19999. The dashboard loads immediately.
Configuration: Retention, Access Control, and Alerts
Editing the Main Config
Netdata ships with a helper that copies default config files into the persistent volume before editing. Use it rather than creating files from scratch:
docker exec -it netdata bash
./edit-config netdata.conf
Key settings I change on every HomeLab node:
[global]
  # Increase in-memory history window
  history = 7200   # 2 hours in seconds

[web]
  # Restrict dashboard to your LAN — do not expose this to the internet
  allow connections from = localhost 192.168.1.*

[db]
  # Persist metrics to disk for multi-day retention
  mode = dbengine
  storage tiers = 1
With mode = dbengine, Netdata compresses metrics onto the netdatacache volume. The default keeps roughly 2 days of data, which covers most HomeLab incidents. If you need longer retention across multiple machines, Netdata Cloud (free tier) aggregates everything centrally.
Telegram Alerts in Under 2 Minutes
Netdata ships with pre-built alert rules for high CPU, low disk space, RAM pressure, network errors, and more. Wiring them to Telegram takes about 2 minutes:
docker exec -it netdata bash
./edit-config health_alarm_notify.conf
Find the Telegram block and fill in your credentials:
SEND_TELEGRAM="YES"
TELEGRAM_BOT_TOKEN="123456789:ABCdefGHIjklMNOpqrSTUvwxYZ"
DEFAULT_RECIPIENT_TELEGRAM="-1001234567890"   # your chat or group ID
Test immediately without triggering a real alert:
/usr/libexec/netdata/plugins.d/alarm-notify.sh test telegramA test message arrives in Telegram within a few seconds.
Silencing Alerts That Don’t Apply to Your Setup
On machines where swap is intentionally disabled, the swap usage alert fires constantly. Silence it rather than leaving it as noise:
docker exec -it netdata bash
./edit-config health.d/swap.conf
Add enabled: no to any rule that doesn’t apply. Raising thresholds to match your actual expectations (instead of generic defaults) is often a better call than outright disabling rules.
Verification & Monitoring: Reading the Dashboard
First Things to Check After Setup
The left sidebar lists every subsystem Netdata discovered. On a typical HomeLab server you’ll find:
- System Overview — CPU, RAM, swap, load average in one place
- Disk — per-disk I/O, utilization, latency. If your NAS or media server is sluggish, start here
- Network Interfaces — per-interface traffic, packets, errors. With
network_mode: host, you see the real interfaces including VPN tunnels (wg0,tun0) - Containers — per-container CPU and memory, sorted by usage. This is the one I open first when something feels off
Container-Level Visibility
Click Containers in the sidebar. Each running container shows up as its own chart group — CPU usage, memory consumption, disk reads/writes, and network I/O, all separated cleanly.
When I first deployed Netdata on my lab, I noticed that Uptime Kuma was doing 15 MB/s of disk writes every few minutes. It was logging aggressively to its SQLite database. Completely invisible before Netdata. Took about 90 seconds to find once I had the dashboard open — before that, I had just accepted the occasional disk bottleneck as unexplained noise.
Confirming Docker Metrics Are Active
If the Containers section is missing or empty, verify the socket mount and check for errors:
# Check for Docker plugin errors
docker exec netdata cat /var/log/netdata/error.log | grep -i docker

# Count active charts — a healthy install with 20-30 containers shows 300-500+
curl -s http://localhost:19999/api/v1/charts | python3 -c "
import sys, json
data = json.load(sys.stdin)
print(f'Active charts: {len(data[\"charts\"])}')
"
Building a Baseline Before You Need It
Spend 10 minutes clicking through the charts right after setup, while the system is under normal load. Note your idle CPU percentage, typical free RAM, and baseline disk I/O. When something breaks at 2 AM, you need a mental model of what normal looks like — Netdata’s color coding (green/yellow/red) also reflects this automatically against the alert thresholds.
Multi-Node View with Netdata Cloud
If your HomeLab spans multiple machines — a NAS, a Proxmox host, a Raspberry Pi — Netdata Cloud gives you a single URL for all of them. Sign up for the free tier, run the claim command on each node, and all dashboards appear in one place:
# Run inside each Netdata container after signing up at app.netdata.cloud
docker exec -it netdata netdata-claim.sh -token=YOUR_CLAIM_TOKEN -rooms=YOUR_ROOM_ID -url=https://app.netdata.cloud
It connects outbound through Netdata’s cloud agent — no new inbound ports to open, no VPN required.
At this point your HomeLab has real-time visibility into every resource that matters. Add a new machine, deploy the container, and it starts reporting immediately. No YAML dashboards to build, no Prometheus scrape configs, no waiting for metrics to arrive 15 seconds late because of a slow polling interval.