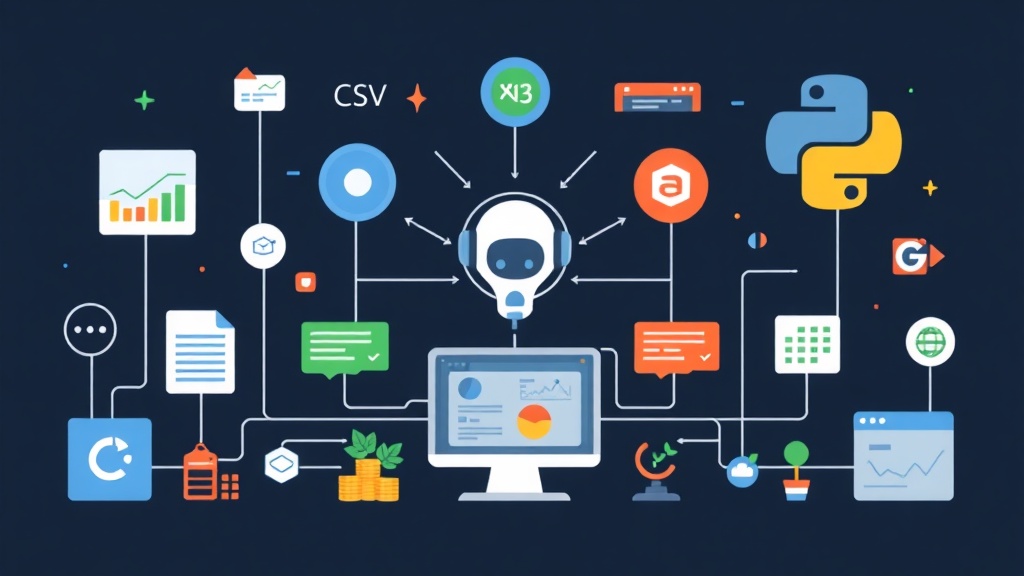
The Problem: Everyone Wants Data, Nobody Wants to Write Pandas
Picture this: your manager sends you a 50,000-row Excel file at 5 PM on Friday and asks, “Can you tell me which regions had the highest returns last quarter, broken down by product category?” You know the answer is somewhere in that spreadsheet. But extracting it requires writing a dozen lines of pandas, groupby, and matplotlib before you can even start thinking about the actual question.
This is the daily reality for anyone sitting between data and decision-makers. The people who need insights the most — sales leads, product managers, executives — rarely speak Python. And making developers the bottleneck for every data question doesn’t scale.
Root Cause: Data Analysis Still Requires Too Much Syntax Knowledge
The core issue isn’t that pandas is hard. It’s that data questions are conversational, but the tools require you to translate them into code first. “Show me monthly revenue trends” becomes:
df['date'] = pd.to_datetime(df['date'])
monthly = df.groupby(df['date'].dt.to_period('M'))['revenue'].sum()
monthly.plot(kind='line', title='Monthly Revenue')
plt.show()
Nothing wrong with that code. But if you have to write it from scratch every time, for every variation of every question, you spend more time writing DataFrame operations than actually thinking about the data.
BI tools like Tableau or Power BI solve part of this — but they’re expensive, require setup and training, and still can’t answer arbitrary natural language questions on raw CSV files without pre-building dashboards.
Solutions Compared: What Are the Real Options?
Option 1: Manual Pandas Scripts
Maximum flexibility, zero magic. Works perfectly if you know pandas well. Falls apart when non-technical teammates need self-service access. Every new question becomes a ticket.
Option 2: BI Tools (Tableau, Power BI, Metabase)
Good for recurring dashboards and structured reporting. Not great for ad-hoc questions on raw files. Requires schema mapping, data connectors, and usually a dedicated analyst to build and maintain the dashboards.
Option 3: ChatGPT Code Interpreter / Claude Artifacts
You upload a file, ask a question, get code and a chart back. Works well for one-off exploration. The problem: it’s a manual, conversational loop. You can’t embed it into your own application or pipeline. No programmatic access, no automation.
Option 4: PandasAI
PandasAI is an open-source Python library that wraps an LLM (OpenAI, Anthropic, Google Gemini, etc.) around a pandas DataFrame. You pass it a natural language question, and it generates and executes the pandas code internally, returning the result. You stay in Python. You keep full control. And the interface is just plain English.
This is the approach I’ve used in production to let non-technical stakeholders query their own data files without opening a terminal. The results have been consistently stable — accurate enough for business reporting, and easy to audit since PandasAI can show you the generated code.
Best Approach: PandasAI in Practice
Step 1: Install the Library
pip install pandasai
pip install pandasai[openai]   # if using OpenAI
pip install pandasai[google]   # if using Gemini
PandasAI supports multiple LLM backends. OpenAI GPT-4o and Google Gemini both work well. For this guide, we’ll use OpenAI.
Step 2: Basic Setup with a CSV File
Let’s say you have a sales CSV with columns: date, region, product, revenue, units_sold.
import pandas as pd
from pandasai import SmartDataframe
from pandasai.llm import OpenAI

# Load your data
df = pd.read_csv("sales_data.csv")

# Connect an LLM
llm = OpenAI(api_token="your-openai-api-key")

# Wrap the DataFrame
sdf = SmartDataframe(df, config={"llm": llm})
That’s the entire setup. SmartDataframe is just a pandas DataFrame with an LLM attached. All standard pandas operations still work on it.
Step 3: Query in Natural Language
# Simple aggregation
result = sdf.chat("What is the total revenue by region?")
print(result)

# Filtering
result = sdf.chat("Show me all transactions where revenue exceeded 10000")
print(result)

# Time-based analysis
result = sdf.chat("What was the best performing product in Q3?")
print(result)
PandasAI translates each question into pandas code, executes it against your DataFrame, and returns either a value, a filtered DataFrame, or a chart — depending on what makes sense for the question.
Step 4: Load Excel Files
Excel files with multiple sheets work just as well:
import pandas as pd
from pandasai import SmartDataframe
from pandasai.llm import OpenAI

# Read a specific sheet
df = pd.read_excel("quarterly_report.xlsx", sheet_name="Q3_Sales")

llm = OpenAI(api_token="your-openai-api-key")
sdf = SmartDataframe(df, config={"llm": llm})

result = sdf.chat("Which salesperson had the highest close rate?")
print(result)
Step 5: Generate Charts Automatically
Ask for a visualization the same way you’d ask for data:
# This generates and saves a chart
sdf.chat("Plot monthly revenue as a bar chart")

# More specific
sdf.chat("Create a line chart showing units sold per region over time")

# With custom styling hints
sdf.chat("Show a pie chart of revenue split by product category")
PandasAI uses matplotlib under the hood. Charts are saved to a charts/ directory by default. You can configure the output path:
sdf = SmartDataframe(df, config={
    "llm": llm,
    "save_charts": True,
    "save_charts_path": "/var/www/output/charts"
})
Step 6: Working with Multiple DataFrames
Real datasets are rarely a single table. PandasAI supports joining multiple DataFrames through SmartDatalake:
from pandasai import SmartDatalake

orders_df = pd.read_csv("orders.csv")
customers_df = pd.read_csv("customers.csv")
products_df = pd.read_csv("products.csv")

lake = SmartDatalake(
    [orders_df, customers_df, products_df],
    config={"llm": llm}
)

result = lake.chat("Which customer segment generates the most revenue per order?")
print(result)
The LLM figures out which tables to join and how, based on column names and context.
Step 7: Inspect the Generated Code
One thing I always do in production setups is enable code logging. This lets you review what PandasAI actually executed — critical for auditing and debugging edge cases:
sdf = SmartDataframe(df, config={
    "llm": llm,
    "verbose": True,       # print generated code to stdout
    "enable_cache": True   # cache identical questions (saves API calls)
})

result = sdf.chat("What is the average revenue per transaction?")
# stdout will show the generated pandas code alongside the result
Practical Tips for Production Use
- Validate column names: PandasAI infers column meaning from names. Rename cryptic columns like
col_Ato descriptive names likemonthly_revenuebefore passing to SmartDataframe. - Cache aggressively: Enable caching (
enable_cache: True) to avoid re-running identical LLM calls. Repeated questions on the same dataset hit the cache and cost nothing. - Set a system prompt: You can give PandasAI domain context — “this is e-commerce sales data where revenue is in USD” — to improve answer quality on ambiguous questions.
- Use Gemini for cost control: Google Gemini Flash is significantly cheaper than GPT-4o for simple aggregation queries. Benchmark both on your actual question types before committing to one backend.
- Log and monitor: In a shared environment where multiple users can ask questions, log every query and the generated code. You need this trail when someone questions an output.
Using an Open-Source LLM (No API Cost)
If you don’t want to send data to a third-party API, PandasAI also supports local models via LangChain or Ollama:
ollama pull llama3
pip install pandasai[langchain]
from pandasai.llm.langchain import LangchainLLM
from langchain_community.llms import Ollama
ollama_llm = Ollama(model="llama3")
llm = LangchainLLM(llama_llm)
sdf = SmartDataframe(df, config={"llm": llm})
result = sdf.chat("Summarize the top 5 products by revenue")
print(result)Local models are slower and less accurate on complex multi-step queries, but they keep your data entirely on-premise — which matters for sensitive business data.
When PandasAI Falls Short
Honest assessment: PandasAI isn’t perfect. It struggles with highly ambiguous questions where domain context matters (“What counts as a successful order?” — the LLM doesn’t know your business rules). It also occasionally generates incorrect pandas for edge cases involving complex time-zone handling or custom categorical ordering.
The practical fix: treat PandasAI as a first-pass layer. Expose the generated code to power users so they can catch and correct misinterpretations. For recurring reports that need to be 100% accurate, lock in the pandas logic manually after PandasAI generates a working first draft.
That hybrid workflow — natural language to generate, human review to validate — is where I’ve found the real productivity gain. Not replacing analysts, but removing the repetitive syntax work that slows them down.