Quick Start: Up and Running in 5 Minutes
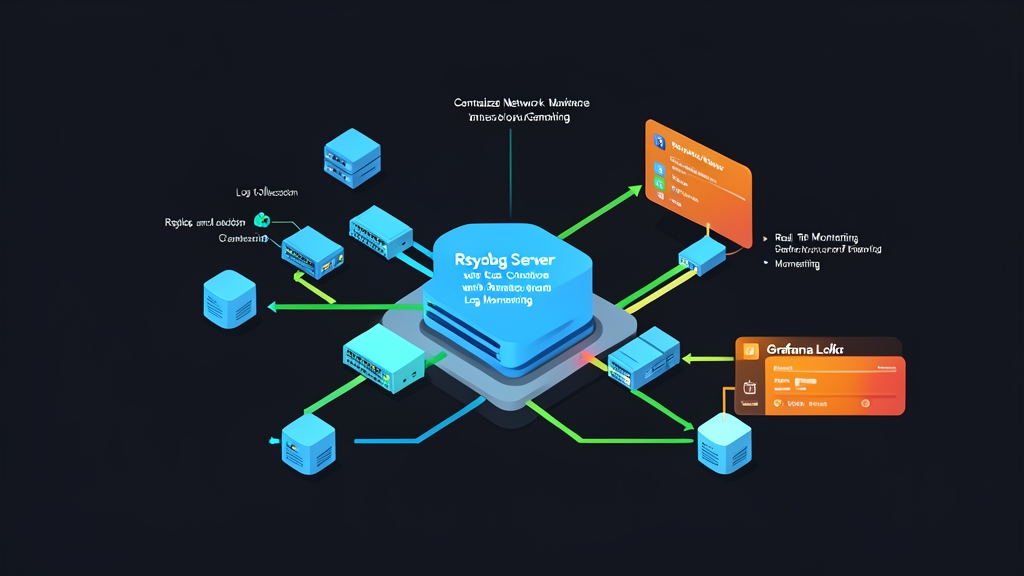
Six months ago, our infrastructure team ripped out a three-node Elasticsearch cluster that consumed 48 GB of RAM just to keep search indices warm. In its place, we rolled out Grafana Loki and Rsyslog. The new setup handles roughly 8,500 syslog events per second across 120 network devices—Cisco Catalyst 9300 switches, FortiGate 200F clusters, and MikroTik CCR edge routers—while sipping under 4 GB of memory.
You can spin up an identical ingestion pipeline on Ubuntu 22.04 or 24.04 LTS in minutes using Docker Compose.
Step 1: Deploy Loki and Grafana
First, create a project folder named network-logging and save this docker-compose.yml file:
version: "3.8"

services:
  loki:
    image: grafana/loki:2.9.4
    container_name: loki
    ports:
      - "3100:3100"
    command: -config.file=/etc/loki/local-config.yaml
    volumes:
      - ./loki-data:/loki
    restart: unless-stopped

  promtail:
    image: grafana/promtail:2.9.4
    container_name: promtail
    volumes:
      - /var/log/network:/var/log/network:ro
      - ./promtail-config.yaml:/etc/promtail/config.yaml:ro
    command: -config.file=/etc/promtail/config.yaml
    restart: unless-stopped

  grafana:
    image: grafana/grafana:10.4.1
    container_name: grafana
    ports:
      - "3000:3000"
    environment:
      - GF_SECURITY_ADMIN_PASSWORD=adminpass
    restart: unless-stopped
Step 2: Bind Rsyslog to UDP/TCP Port 514
Next, configure host-level Rsyslog to receive incoming network traffic. Drop this snippet into a new drop-in file at /etc/rsyslog.d/10-network-input.conf:
module(load="imudp")
input(type="imudp" port="514")

module(load="imtcp")
input(type="imtcp" port="514")

# Split incoming logs by host IP: /var/log/network/<DEVICE_IP>/syslog.log
template(name="NetLogPath" type="string" string="/var/log/network/%fromhost-ip%/syslog.log")
*.* ?NetLogPath
& stop
Prepare the directory permissions and restart the service:
sudo mkdir -p /var/log/network
sudo chmod -R 755 /var/log/network
sudo systemctl restart rsyslog
Step 3: Point Promtail to the Syslog Files
Promtail tails those raw disk files, attaches metadata labels, and pushes the compressed batches into Loki. Save this as promtail-config.yaml in your project directory:
server:
  http_listen_port: 9080
  grpc_listen_port: 0

positions:
  filename: /tmp/positions.yaml

clients:
  - url: http://loki:3100/loki/api/v1/push

scrape_configs:
  - job_name: network_syslog
    static_configs:
      - targets:
          - localhost
        labels:
          job: network_devices
          __path__: /var/log/network/*/*.log
    pipeline_stages:
      - regex:
          expression: '^/var/log/network/(?P<device_ip>[^/]+)/.*\.log$'
          source: filename
      - labels:
          device_ip: ""
Bring up the containers:
docker compose up -d
Open Grafana at http://<your-server-ip>:3000. Sign in with admin / adminpass, add Loki (http://loki:3100) as a data source, and query your stream using {job="network_devices"}.
Deep Dive: Architecture and Pipeline Mechanics
Traditional tools like Elasticsearch or OpenSearch parse incoming text strings into inverted indexes. That works well for arbitrary search queries. However, it falls apart fast when noisy firewalls spit out 40,000 drop events every second during an internet-wide sweep. RAM usage spikes, disks thrash, and cluster maintenance turns into a full-time job.
Why Rsyslog as the Front Gate?
Rsyslog is written in C and runs in kernel-adjacent user space. It ingests high-frequency UDP packets far more efficiently than Java or Go collectors like Logstash or Vector. If an access switch starts link flapping wildly, Rsyslog holds lines in an in-memory ring buffer without choking your CPU cores.
The Loki Philosophy: Index Labels, Not Text
Loki flips the standard indexing model upside down. It leaves the log body untouched, gzip-compresses it into chunks, and writes those chunks directly to disk or S3-compatible storage. It indexes only the stream metadata labels: job, device_ip, and environment.
This design choice cut our storage footprint from 1.2 TB down to roughly 140 GB per month. Queries still run fast because Grafana fans out grep-like filtering across chunk boundaries in parallel.
Device Configuration Walkthrough
Configure your network appliances to ship events to your Ubuntu host over port 514:
# Cisco IOS / IOS-XE
logging host 192.168.10.50 transport udp port 514
logging trap informational
logging facility local6
logging source-interface GigabitEthernet0/0

# Fortinet FortiGate (CLI)
config log syslogd setting
    set status enable
    set server "192.168.10.50"
    set mode udp
    set port 514
    set facility local7
    set format default
end

# MikroTik RouterOS v7
/system logging action add name=central-syslog target=remote remote=192.168.10.50 remote-port=514 src-address=192.168.10.1
/system logging add action=central-syslog topics=critical,error,warning,info
Advanced Usage: Parsing and Alerting with LogQL
Raw text streams become powerful once you parse and filter them on demand inside Grafana.
Extracting Fields on Read
Cisco syslog lines follow a predictable format: %FACILITY-SEVERITY-MNEMONIC: Description. Instead of defining schema mappings beforehand, parse fields at query time with LogQL pattern matching:
{device_ip="192.168.10.1"}
  |= "%LINK-3-UPDOWN:"
  | pattern "<_> %LINK-3-UPDOWN: Interface <interface>, changed state to <status>"
This query pulls out the interface and status fields on the fly. You can plug them straight into a Grafana table panel to spot flapping ports across your campus core.
Building Metric Streams from Raw Logs
You can also aggregate raw logs into Prometheus-style time series:
sum by (device_ip) (
  rate({job="network_devices"} |= "action=deny" [1m])
)
This calculates dropped firewall packets per second for every device. Sudden spikes will pinpoint internal malware scans or perimeter brute-force attacks within seconds.
Configuring Real-Time Alert Rules
Catch routing drops immediately by adding an alert rule to your Loki configuration:
groups:
  - name: network-alerts
    rules:
      - alert: BGPNeighborDown
        expr: |
          count_over_time({job="network_devices"} |= "%BGP-5-ADJCHANGE:" |= "Down" [2m]) > 0
        for: 0m
        labels:
          severity: critical
        annotations:
          summary: "BGP peer session dropped on {{ $labels.device_ip }}"
Practical Tips: Hardening and Production Tuning
Operating this pipeline in production highlighted three bottlenecks worth addressing early.
1. Avoid High-Cardinality Labels
Never extract dynamic values like remote client IPs, MAC addresses, or TCP ports into Promtail labels. Loki generates a separate index stream for every unique label combination. Ten thousand unique client IPs will quickly create ten thousand streams, ballooning Loki's index and tanking search speed. Stick to low-cardinality labels such as site, role, and device_ip.
2. Tune Rsyslog UDP Socket Buffers
Under heavy bursts, the Linux kernel silently drops incoming UDP datagrams when the OS receive buffer saturates. Check your drop tally with this command:
netstat -su | grep "receive errors"
If that counter climbs, increase the kernel receive buffer to 25 MB in /etc/sysctl.d/99-syslog.conf:
net.core.rmem_default = 26214400
net.core.rmem_max = 26214400
Reload the sysctl values without a reboot:
sudo sysctl -p /etc/sysctl.d/99-syslog.conf
3. Enforce Retention in the Compactor
Network devices produce huge volumes of operational chatter. Set an explicit retention window in loki-config.yaml to clear out old chunks and protect your storage:
compactor:
  working_directory: /loki/compactor
  compactor_ring:
    kvstore:
      store: inmemory
  retention_enabled: true

schema_config:
  configs:
    - from: 2024-01-01
      store: tsdb
      object_store: filesystem
      schema: v13
      index:
        prefix: index_
        period: 24h

limits_config:
  retention_period: 30d
This keeps NVMe disk usage bounded while preserving 30 days of clean, searchable audit records for compliance.