The Silent Killer: Intermittent Packet Loss and Latency Spikes
Your monitoring dashboard glows entirely green. Every HTTP check returns a clean 200 OK. Yet support tickets pile up: customers report sluggish page loads, video calls stutter every few minutes, and interactive SSH sessions freeze without warning. Traditional monitoring agents report the host is healthy, but the path between your servers and your users is quietly falling apart.
Most basic health checks evaluate network health through a binary lens. They fire a single ICMP echo or HTTP GET request once every sixty seconds. If that lone packet completes the round trip, the monitor marks the service 100% operational.
But real-world networks rarely collapse outright. Instead, they bleed performance through micro-burst congestion, bufferbloat, and routing flaps. A link dropping just 2% to 5% of packets won’t trigger an uptime alarm. However, that small loss forces TCP into repeated retransmission timeouts and cuts throughput from 500 Mbps down to a crawl—often under 15 Mbps.
Why Point-in-Time Pings Fail: The Need for Smokeping
Hunting down transient network glitches after a customer complains is notoriously frustrating. Running an ad-hoc ping or mtr ten minutes after the incident usually returns flawless 15 ms response times because the burst of congestion has already passed. Without historical telemetry that captures latency distribution over time, you are debugging blind.
Smokeping fixes this fundamental flaw. Rather than dispatching an isolated ping, Smokeping fires a continuous train of probes—typically 20 packets per sample cycle—against your targets via fast, low-overhead engines like fping.
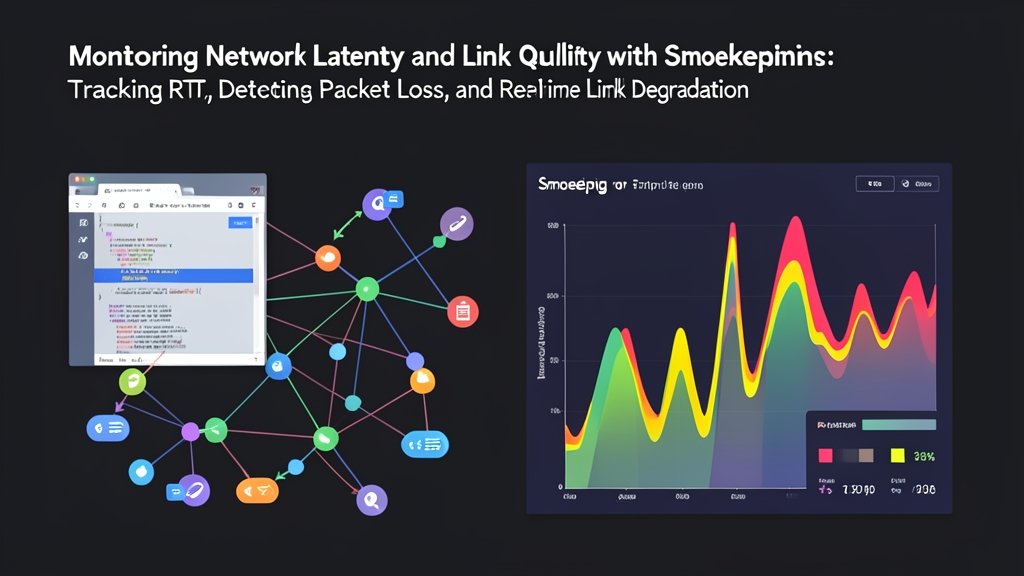
Plotting those bursts reveals patterns that standard uptime graphs completely hide:
- Median RTT: The solid baseline line tracks your typical latency floor across minutes, days, or months.
- Latency Variance and Jitter: Shaded bands of "smoke" wrap around the median line to show packet dispersion. Tight smoke means a rock-solid link. Thick smoke reveals wild jitter, packet delay variation (PDV), or router bufferbloat where packets queue up under load.
- Packet Loss: Color shifts across the median line highlight dropped packets in each burst, pinpointing exactly when a link began dropping traffic.
Smokeping isn’t limited to basic ICMP either. Pluggable probes let you test DNS resolution latencies, TCP three-way handshakes, TLS negotiation overhead, and HTTP response times across data centers, cloud VPC peerings, and branch offices.
Step-by-Step Deployment on Debian and Ubuntu
Here is how to set up Smokeping on Ubuntu 24.04 or Debian 12, backed by Nginx and fcgiwrap to serve the web interface.
Step 1: Install Required Packages
First, refresh your package index and install the monitoring daemon, the fping utility, Nginx, and the FastCGI wrapper:
sudo apt update
sudo apt install -y smokeping fping fcgiwrap nginx
On modern Linux releases, fping requires the CAP_NET_RAW capability to open unprivileged ICMP sockets. While older tutorials rely on SUID permissions, setcap is the safer, standard practice:
sudo setcap cap_net_raw+ep /usr/bin/fpingStep 2: Configure Probes and Sampling Rates
Smokeping organizes its settings inside /etc/smokeping/config.d/. Global measurement intervals—such as the step duration (defaulting to 300 seconds) and the number of pings per burst (typically 20)—live in /etc/smokeping/config.d/Database.
To inspect or customize your probe binaries, edit /etc/smokeping/config.d/Probes:
sudo nano /etc/smokeping/config.d/ProbesVerify that the default FPing probe points to the correct executable, and optionally add a secondary probe like DNS to track resolver response times:
*** Probes ***

+ FPing
binary = /usr/bin/fping

+ DNS
binary = /usr/bin/dig
lookup = cloudflare.com
pings = 10
Step 3: Define Monitoring Targets
Next, configure the destinations you want to track in /etc/smokeping/config.d/Targets. Smokeping builds its navigation tree hierarchically using plus signs (+, ++, +++):
sudo nano /etc/smokeping/config.d/TargetsReplace the boilerplate defaults with a practical operational hierarchy:
*** Targets ***

probe = FPing

menu = Top
title = Network Latency & Jitter Monitor
remark = Continuous telemetry across transit providers, core gateways, and external APIs.

+ Infrastructure
menu = Core Network
title = Core Infrastructure and Gateways

++ DefaultGateway
menu = Default Gateway
title = Local Upstream Gateway (192.168.1.1)
host = 192.168.1.1

++ CloudflareDNS
menu = Cloudflare DNS
title = Cloudflare Public Anycast (1.1.1.1)
host = 1.1.1.1

++ GoogleDNS
menu = Google DNS
title = Google Public Anycast (8.8.8.8)
host = 8.8.8.8

+ ExternalAPIs
menu = External APIs
title = Critical Cloud and SaaS Dependencies

++ GitHub
menu = GitHub
title = GitHub Web Frontends (github.com)
host = github.com
Step 4: Configure Nginx with FastCGI
Smokeping renders its web interface through Perl CGI scripts and dynamically generated RRDtool charts. Pair it with fcgiwrap to run under Nginx. Create a dedicated site profile:
sudo nano /etc/nginx/sites-available/smokepingAdd this virtual host block:
server {
    listen 80;
    server_name smokeping.example.internal;

    root /usr/share/smokeping/www;
    index smokeping.cgi;

    location / {
        try_files $uri $uri/ =404;
    }

    location ~ \.cgi$ {
        fastcgi_pass unix:/var/run/fcgiwrap.socket;
        include /etc/nginx/fastcgi_params;
        fastcgi_param SCRIPT_FILENAME $document_root$fastcgi_script_name;
    }

    location /smokeping/images/ {
        alias /var/cache/smokeping/images/;
    }
}
Activate the configuration, unbind the default Nginx placeholder site, and reload your services:
sudo ln -s /etc/nginx/sites-available/smokeping /etc/nginx/sites-enabled/
sudo rm -f /etc/nginx/sites-enabled/default
sudo systemctl restart fcgiwrap
sudo systemctl restart nginx
sudo systemctl restart smokeping
Step 5: Verify Telemetry and RRD Storage
Allow Smokeping to run through two full probe cycles—roughly 10 minutes—so it can populate baseline data. Point your browser at your server’s IP or configured domain, navigate to Core Network, and inspect the Cloudflare Public Anycast graph.
Having an ongoing RTT baseline completely changes post-mortem investigations. Instead of arguing with an ISP or cloud support team over vague tickets, you have timestamped evidence showing an RTT jump from 18 ms to 145 ms during peak hours.
To ensure the collector is updating your Round Robin Databases (RRDs) without file permission hurdles, check the storage directory:
ls -lh /var/lib/smokeping/Infrastructure/Each target should show an active .rrd file updated within the last five minutes.
Operational Pitfalls and Hard-Earned Tips
Keep these production considerations in mind when running latency probes:
- Socket and Permission Pitfalls: A 502 Bad Gateway error almost always points to FastCGI. Check
sudo systemctl status fcgiwrapand verify that/var/run/fcgiwrap.socketis owned bywww-datawith read and write permissions. - Aggressive Probing and ICMP Rate Limits: Avoid cranking probe settings up to extremes (like 100 pings every 10 seconds). Upstream carriers, cloud security groups, and transit routers frequently drop high-frequency ICMP bursts through Control Plane Policing (CoPP). You will trigger false packet loss alarms on links that are otherwise healthy.
- Deploying Multiple Vantage Points: A single probe host cannot distinguish between local edge link saturation and remote carrier outages. Deploying two or three lightweight Smokeping agents—one on-prem, one in an AWS VPC, and one on an inexpensive third-party VPS—lets you triangulate exactly where the degradation starts.
Wrapping Up
Catching intermittent network degradation requires persistent, statistical observation. Single pings hide the truth. By gathering measured bursts and displaying RTT distribution alongside dropped packets, Smokeping surfaces bufferbloat, transit routing flaps, and silent packet loss long before users notice.