Real-World Problem: The Night Our MySQL Cluster Collapsed
Six months ago, our e-commerce API experienced a traffic spike during a flash sale that exposed every architectural weakness in our database tier. Our Kubernetes clusters scaled from 20 to 120 application pods within three minutes. Almost immediately, our primary MySQL database rejected incoming traffic with the infamous error: ERROR 1040 (08004): Too many connections.
Application response latency jumped from 45 milliseconds to over 8 seconds. Worse, our primary writer node crashed under CPU exhaustion, even though 85% of incoming requests were simple read queries fetching product catalogs and user profiles.
Having worked with MySQL, PostgreSQL, and MongoDB across different projects, each has its own strengths, but MySQL replication architectures require deliberate traffic management once backend concurrency spikes. We had three read replicas sitting practically idle while the primary node was suffocating under hundreds of unpooled connection handshakes and mixed query workloads.
Root Cause Analysis: Why MySQL Chokes Under High Concurrency
When our team analyzed the post-incident telemetry, we identified three architectural flaws hurting our MySQL cluster:
1. The Cost of Thread-per-Connection
MySQL traditionally allocates an operating system thread for each client connection. Every connection reserves memory for internal buffers—including sort_buffer_size, read_buffer_size, and connection stack memory. When 120 container replicas each maintain a pool of 30 connections, MySQL must juggle 3,600 active threads. The Linux kernel spends more CPU cycles on context switching than MySQL spends executing queries.
2. Inflexible Application-Level Routing
Our microservices were configured with dual data sources: one pointing to the writer and another to a round-robin DNS of read replicas. In practice, developers frequently wrapped simple read queries inside transaction blocks or forgot to mark database transactions as read-only. As a result, the ORM sent those queries directly to the writer node, completely bypassing our read replicas.
3. Query Redundancy and Cache Stampedes
During the flash sale, tens of thousands of users viewed the exact same top ten discounted items. Every single page load triggered fresh SELECT queries against the database. Because we lacked an intermediary query cache between the application layer and MySQL, identical queries pounded disk I/O repeatedly.
Solutions Compared: Finding the Right Middleware
To eliminate these bottlenecks without rewriting thousands of lines of application code, we evaluated three potential architectures before making a decision.
Option 1: Code-Level Routing and Local Pooling (HikariCP / ORM Plugins)
We initially attempted to tune client-side connection pools and enforce stricter read/write annotations in code. While this avoids deploying additional infrastructure, it suffers from severe limitations in containerized environments. When microservices scale dynamically, total database connections multiply uncontrollably. Furthermore, any routing rule change requires a full code deployment and pod restart.
Option 2: Network-Layer Load Balancers (HAProxy / AWS NLB)
HAProxy functions exceptionally well as a Layer 4 TCP proxy. However, Layer 4 balancers are blind to SQL payloads. They cannot inspect query text, which means they cannot separate a SELECT from an UPDATE incoming on the same port. You must expose two separate application endpoints—one for writes and one for reads—leaving the routing burden entirely on application developers.
Option 3: Layer 7 SQL-Aware Proxy (ProxySQL)
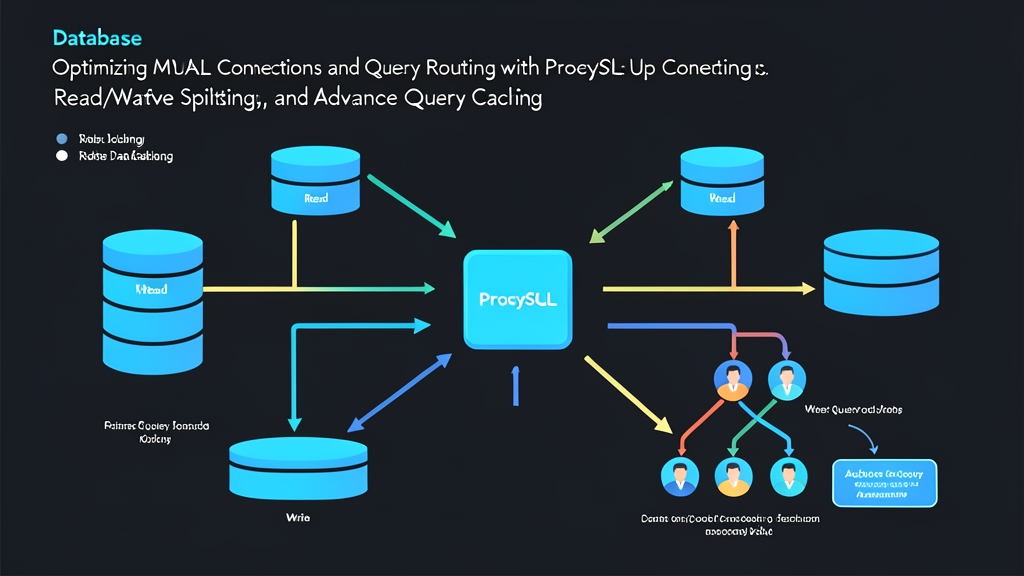
ProxySQL operates at the application protocol layer (Layer 7). It speaks native MySQL wire protocol, maintains its own persistent connection pool to backend servers, inspects SQL statements via regex patterns, and can cache result sets in memory. It decouples client connections from backend database threads through multiplexing: 5,000 application connections can easily be served by only 60 persistent backend MySQL connections.
Best Approach: Production Setup with ProxySQL
After six months of running ProxySQL in front of our primary-replica cluster, our database metrics stabilized completely. Here is the exact configuration strategy we used to achieve connection multiplexing, intelligent read/write splitting, and high-performance query caching.
Step 1: Connecting to the ProxySQL Admin Interface
ProxySQL runs as an independent daemon. It exposes two ports: 6033 for incoming application SQL traffic, and 6032 for administrative configuration using standard MySQL client syntax.
# Connect to ProxySQL Admin interface
mysql -u admin -padmin -h 127.0.0.1 -P 6032 --prompt='ProxySQL Admin> '
Step 2: Defining Backend Hostgroups
ProxySQL groups database servers into hostgroups. In our topology, Hostgroup 10 is reserved for the primary writer node, while Hostgroup 20 contains our read replicas.
-- Insert primary writer (Hostgroup 10)
INSERT INTO mysql_servers (hostgroup_id, hostname, port, max_connections, weight)
VALUES (10, '192.168.10.11', 3306, 100, 1000);

-- Insert read replicas (Hostgroup 20)
INSERT INTO mysql_servers (hostgroup_id, hostname, port, max_connections, weight)
VALUES
  (20, '192.168.10.12', 3306, 150, 100),
  (20, '192.168.10.13', 3306, 150, 100);

-- Persist configuration to runtime and disk
LOAD MYSQL SERVERS TO RUNTIME;
SAVE MYSQL SERVERS TO DISK;
Step 3: Configuring Users and Connection Pooling
ProxySQL needs credentials to validate incoming application traffic and establish pooled backend connections. ProxySQL handles connection pooling automatically using its multiplexing engine.
-- Define application user with default hostgroup pointed to Writer
INSERT INTO mysql_users (username, password, default_hostgroup, transaction_persistent)
VALUES ('app_user', 'SecurePassword123!', 10, 1);

LOAD MYSQL USERS TO RUNTIME;
SAVE MYSQL USERS TO DISK;
The setting transaction_persistent=1 ensures that when a transaction begins (BEGIN or START TRANSACTION), all subsequent queries in that session stay pinned to the writer hostgroup until a COMMIT or ROLLBACK occurs, avoiding read-after-write consistency errors.
Step 4: Automated Read/Write Splitting with Query Rules
We direct write queries, explicit locks, and transactions to Hostgroup 10, while offloading general read queries to Hostgroup 20. ProxySQL evaluates rules sequentially based on the rule_id.
-- Rule 1: Send write queries and lock checks to the Writer (Hostgroup 10)
INSERT INTO mysql_query_rules (rule_id, active, match_pattern, destination_hostgroup, apply)
VALUES
  (100, 1, '^SELECT.*FOR UPDATE', 10, 1),
  (101, 1, '^(INSERT|UPDATE|DELETE|REPLACE)', 10, 1);

-- Rule 2: Route all general SELECT queries to Read Replicas (Hostgroup 20)
INSERT INTO mysql_query_rules (rule_id, active, match_pattern, destination_hostgroup, apply)
VALUES (200, 1, '^SELECT', 20, 1);

LOAD MYSQL QUERY RULES TO RUNTIME;
SAVE MYSQL QUERY RULES TO DISK;
With these three rules active, developers no longer worry about which database host to query. The application connects exclusively to ProxySQL on port 6033, and query routing happens transparently in microseconds.
Step 5: Implementing Query Caching for High-Frequency Reads
MySQL dropped its native query cache in version 8.0 because of global mutex contention. ProxySQL restores query caching functionality safely outside the storage engine. You can cache expensive or frequent reads directly inside ProxySQL’s memory by adding a cache TTL in milliseconds:
-- Cache product catalog queries for 5 seconds (5000ms)
INSERT INTO mysql_query_rules (rule_id, active, match_pattern, destination_hostgroup, cache_ttl, apply)
VALUES (300, 1, '^SELECT.*FROM products WHERE status = .published.', 20, 5000, 1);

LOAD MYSQL QUERY RULES TO RUNTIME;
SAVE MYSQL QUERY RULES TO DISK;
During our most recent promotional campaign, this single rule served 12,000 queries per second directly from ProxySQL RAM, keeping replica CPU utilization under 20%.
Step 6: Verifying Traffic and Metrics
ProxySQL provides comprehensive runtime diagnostic tables that show real-time connection pooling efficiency and cache hits:
-- Inspect hostgroup connection pool usage
SELECT hostgroup, srv_host, status, ConnUsed, ConnFree, ConnOK
FROM stats_mysql_connection_pool;

-- Inspect query rule hits and execution counts
SELECT rule_id, hits FROM stats_mysql_query_rules ORDER BY hits DESC;

-- Check query cache performance
SELECT * FROM stats_mysql_global WHERE Variable_Name LIKE 'Query_Cache%';
Six-Month Production Review: The Results
Operating ProxySQL in production over the past two quarters delivered concrete performance gains:
- Backend Connections: Dropped from an unpredictable peak of 3,800 direct connections down to 75 multiplexed connections across our three MySQL instances.
- Query Latency: P95 read response times decreased from 42ms to 8ms thanks to connection reuse and edge query caching.
- Zero-Downtime Maintenance: We can now set a replica offline inside ProxySQL via
status='OFFLINE_SOFT', allow existing transactions to complete gracefully, perform database upgrades, and bring it back online without dropping a single user request.
For teams running high-traffic MySQL clusters, adding ProxySQL as a dedicated proxy layer solves connection saturation and read scaling without demanding architectural rewrites from your application developers.