
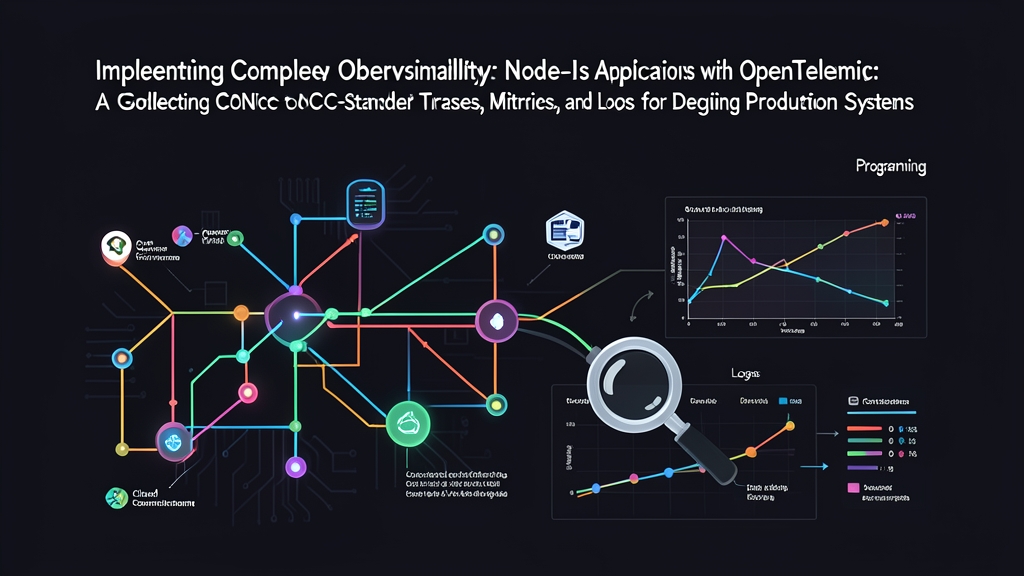
Bối cảnh: Vượt qua sự cố production với OpenTelemetry
Debug Node.js trên localhost vốn rất đơn giản. Nhưng production chịu tải cao lại là một câu chuyện hoàn toàn khác. Khi độ trễ p99 của endpoint thanh toán tăng vọt từ 45ms lên 4,2 giây trong đợt flash sale, các dòng console.log thông thường sẽ biến thành một bức tường văn bản hỗn độn và khó đọc. Mốc thời gian (timestamp) bị lệch giữa các callback bất đồng bộ. Bạn rơi vào thế phải đoán mò: liệu truy vấn Postgres có bị nghẽn trên bảng chưa đánh index, webhook của Stripe bị timeout, hay một payload JSON nặng 12MB đang làm nghẽn event loop đơn luồng?
OpenTelemetry (OTel) giúp bạn chấm dứt việc đoán mò đó. Được hậu thuẫn bởi Cloud Native Computing Foundation (CNCF), OTel mang lại một tiêu chuẩn phi phụ thuộc nhà cung cấp (vendor-neutral) cho telemetry. Thay vì giam cầm mã nguồn của bạn trong một agent APM độc quyền, OTel chuẩn hóa cách phát ra ba tín hiệu telemetry cốt lõi:
- Traces: Theo dõi một HTTP request xuyên suốt các hàm, microservice và cơ sở dữ liệu nhờ các trace ID và span ID được chèn tự động.
- Metrics: Các số liệu tổng hợp định lượng (thông lượng request, thời gian tạm dừng GC, độ trễ event loop) được tính toán theo các khoảng thời gian trượt (rolling intervals).
- Logs: Các sự kiện có cấu trúc được liên kết trực tiếp với trace ID đang hoạt động, giúp bạn cô lập ngữ cảnh lỗi chỉ trong vài giây.
Việc tương quan (correlate) cả ba tín hiệu này biến những cuộc chữa cháy lúc nửa đêm thành quy trình truy tìm nguyên nhân gốc rễ (root cause) chỉ mất 30 giây.
Cài đặt: Tích hợp OpenTelemetry Node.js SDK
OTel sử dụng kiến trúc dạng module. Bạn chỉ cần cài đặt những thành phần mà ứng dụng thực sự cần. Dưới đây là cách thiết lập một dịch vụ Express với tính năng tự động thu thập dữ liệu (automatic instrumentation) và các exporter giao thức OpenTelemetry Protocol (OTLP):
mkdir node-otel-demo
cd node-otel-demo
npm init -y

# Cài đặt Express và OpenTelemetry API
npm install express @opentelemetry/api

# Cài đặt SDK runtime, auto-instrumentations và các OTLP exporter
npm install @opentelemetry/sdk-node \
  @opentelemetry/auto-instrumentations-node \
  @opentelemetry/sdk-metrics \
  @opentelemetry/resources \
  @opentelemetry/semantic-conventions \
  @opentelemetry/exporter-trace-otlp-proto \
  @opentelemetry/exporter-metrics-otlp-proto
Dưới đây là vai trò của từng thành phần:
@opentelemetry/api: Gói API cung cấp các hàm tracing và context cho mã ứng dụng của bạn.@opentelemetry/sdk-node: Engine runtime có nhiệm vụ khởi tạo tracer provider, metric reader và background exporter trước khi ứng dụng khởi động.@opentelemetry/auto-instrumentations-node: Các hook do cộng đồng duy trì, tự động bọc (wrap) các module nhưhttp,express,pg,ioredisvàmongodb.@opentelemetry/exporter-*-otlp-proto: Các exporter protobuf hiệu năng cao, truyền dữ liệu telemetry qua HTTP/gRPC đến các collector như Grafana Tempo, Jaeger hoặc SigNoz.
Cấu hình: Thiết lập instrumentation cho Node.js chuẩn xác
Thứ tự khởi tạo là yếu tố quyết định. OpenTelemetry phải patch các module cốt lõi của Node.js trước khi ứng dụng nạp các dependency. Nếu Express hoặc pg được import trước OTel, các network socket gửi ra ngoài và các route handler sẽ không được instrument.
Bước 1: Tạo module Instrumentation
Tạo file instrumentation.js tại thư mục gốc của dự án. Hãy tách biệt logic này với phần khởi động web server.
// instrumentation.js
const { NodeSDK } = require('@opentelemetry/sdk-node');
const { getNodeAutoInstrumentations } = require('@opentelemetry/auto-instrumentations-node');
const { OTLPTraceExporter } = require('@opentelemetry/exporter-trace-otlp-proto');
const { PeriodicExportingMetricReader, ConsoleMetricExporter } = require('@opentelemetry/sdk-metrics');
const { Resource } = require('@opentelemetry/resources');
const { SemanticResourceAttributes } = require('@opentelemetry/semantic-conventions');

const traceExporter = new OTLPTraceExporter({
  url: process.env.OTEL_EXPORTER_OTLP_TRACES_ENDPOINT || 'http://localhost:4318/v1/traces',
});

const metricReader = new PeriodicExportingMetricReader({
  exporter: new ConsoleMetricExporter(),
  exportIntervalMillis: 15000,
});

const sdk = new NodeSDK({
  resource: new Resource({
    [SemanticResourceAttributes.SERVICE_NAME]: 'order-api-service',
    [SemanticResourceAttributes.SERVICE_VERSION]: '1.2.0',
    [SemanticResourceAttributes.DEPLOYMENT_ENVIRONMENT]: process.env.NODE_ENV || 'production',
  }),
  traceExporter,
  metricReader,
  instrumentations: [getNodeAutoInstrumentations()],
});

sdk.start();

// Đẩy nốt các span còn lại trước khi kết thúc tiến trình
const shutdown = () => {
  sdk.shutdown()
    .then(() => console.log('[OTel] Đã hoàn tất tắt SDK'))
    .catch((err) => console.error('[OTel] Lỗi khi tắt SDK', err))
    .finally(() => process.exit(0));
};

process.on('SIGTERM', shutdown);
process.on('SIGINT', shutdown);
Bước 2: Xây dựng ứng dụng mẫu liên kết Log với Trace
Tạo file app.js. Chúng ta sẽ tạo các custom span bao quanh business logic quan trọng và chèn metadata của trace vào payload JSON của log.
// app.js
const express = require('express');
const opentelemetry = require('@opentelemetry/api');

const app = express();
const PORT = process.env.PORT || 3000;

// Liên kết log stdout với span đang hoạt động
function logWithTrace(level, message, data = {}) {
  const activeSpan = opentelemetry.trace.getActiveSpan();
  const spanContext = activeSpan ? activeSpan.spanContext() : null;

  const payload = {
    timestamp: new Date().toISOString(),
    level,
    message,
    trace_id: spanContext ? spanContext.traceId : 'none',
    span_id: spanContext ? spanContext.spanId : 'none',
    ...data,
  };
  console.log(JSON.stringify(payload));
}

app.get('/api/orders/:id', async (req, res) => {
  const orderId = req.params.id;
  const tracer = opentelemetry.trace.getTracer('order-tracer');

  // Tạo span con tường minh để đo lường chi tiết thời gian
  return tracer.startActiveSpan('process-order-logic', async (span) => {
    try {
      span.setAttribute('app.order.id', orderId);
      logWithTrace('info', 'Đang xử lý yêu cầu đơn hàng', { orderId });

      // Giả lập truy vấn cơ sở dữ liệu mất 120ms
      await new Promise((resolve) => setTimeout(resolve, 120));

      if (orderId === 'invalid') {
        throw new Error('Không tìm thấy đơn hàng: bản ghi 0x404 không tồn tại trong primary replica');
      }

      span.setStatus({ code: opentelemetry.SpanStatusCode.OK });
      res.status(200).json({ status: 'success', orderId, totalCents: 4999 });
    } catch (err) {
      span.recordException(err);
      span.setStatus({
        code: opentelemetry.SpanStatusCode.ERROR,
        message: err.message,
      });
      logWithTrace('error', err.message, { orderId });
      res.status(404).json({ error: err.message });
    } finally {
      span.end();
    }
  });
});

app.listen(PORT, () => {
  console.log(`Server đang lắng nghe tại cổng ${PORT}`);
});
Kiểm thử & Triển khai lên Production
Preload file instrumentation bằng cờ native --require của Node trước khi khởi động tiến trình chính. Điều này đảm bảo các hook telemetry được gắn vào trước khi Express khởi tạo.
node --require ./instrumentation.js app.js1. Gửi các request kiểm thử
Gửi hai request mẫu để xem OTel xử lý luồng thực thi thành công và thất bại như thế nào:
# 1. Request thành công (tạo span OK và trace HTTP 200 tiêu chuẩn)
curl -i http://localhost:3000/api/orders/order_8829

# 2. Request thất bại (ghi lại exception và đặt trạng thái span thành ERROR)
curl -i http://localhost:3000/api/orders/invalid
2. Cơ chế liên kết Trace-với-Log trong thực tế
Kiểm tra stdout của ứng dụng. Bộ định dạng log xuất ra các bản ghi JSON có cấu trúc chứa các giá trị W3C trace_id và span_id khớp nhau:
{"timestamp":"2026-11-16T11:50:00.123Z","level":"error","message":"Không tìm thấy đơn hàng: bản ghi 0x404 không tồn tại trong primary replica","trace_id":"4bf92f3577b34da6a3ce929d0e0e4736","span_id":"00f067aa0ba902b7","orderId":"invalid"}Khi PagerDuty cảnh báo bạn lúc 2 giờ sáng, hãy truy vấn log aggregator (như Loki, Datadog hoặc Elasticsearch) để tìm thông báo lỗi. Lấy trace_id và dán vào Jaeger hoặc Grafana Tempo. Ngay lập tức, bạn sẽ thấy biểu đồ waterfall toàn diện: chính xác 120ms chờ cơ sở dữ liệu trước khi lỗi xuất hiện.
3. Các bước tiếp theo trên Production
- Tách rời (Decouple) bằng OTel Collector: Tránh gửi trực tiếp dữ liệu telemetry từ các instance Node.js trên production đến các endpoint của bên thứ ba. Hãy triển khai OpenTelemetry Collector dưới dạng Kubernetes sidecar hoặc DaemonSet cục bộ. Collector sẽ gom nhóm các span theo lô (ví dụ: buffer 512 bản ghi), nén payload và giảm tải mạng (networking overhead) cho event loop của Node.
- Cấu hình head-based sampling: Ở mức 10.000 request mỗi giây, việc thu thập 100% traces sẽ lãng phí dung lượng lưu trữ và chi phí. Hãy thiết lập
OTEL_TRACES_SAMPLER=parentbased_traceidratiocùng tỷ lệOTEL_TRACES_SAMPLER_ARG=0.05để chỉ ghi lại 5% lượng traffic bình thường trong khi vẫn thu thập 100% các exception. - Sử dụng các biến môi trường tiêu chuẩn: Tuyệt đối không hardcode endpoint của collector vào mã nguồn. Hãy cấu hình
OTEL_EXPORTER_OTLP_ENDPOINT=http://otel-collector:4318vàOTEL_SERVICE_NAME=order-apithông qua deployment manifest của bạn.