
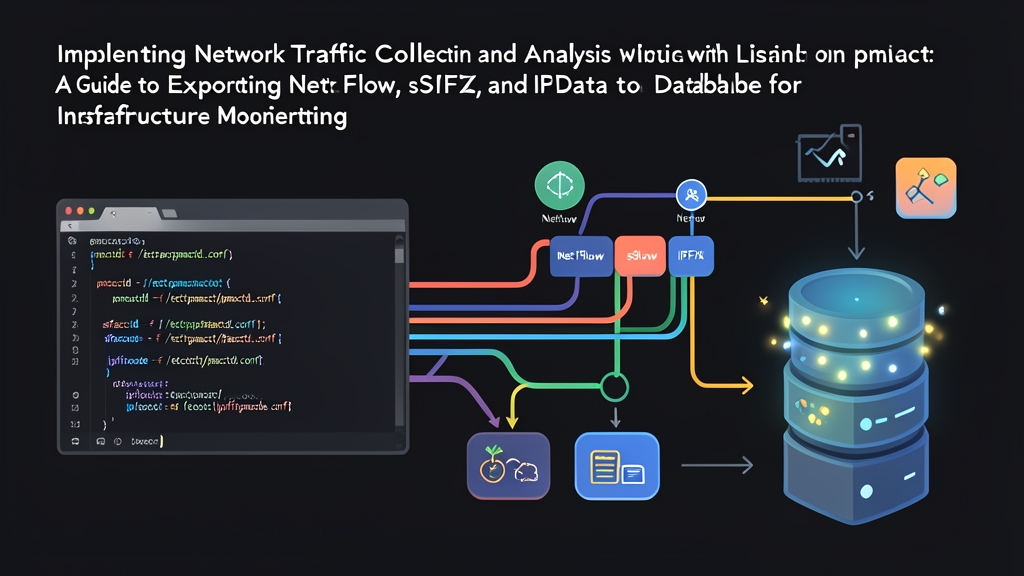
Network Monitoring: Choosing the Right Telemetry
Monitoring high-speed networks requires tough engineering trade-offs. If your edge routers push tens of gigabits per second, capturing every packet will quickly overwhelm your disks. Conversely, simple interface graphs miss critical incident details. Infrastructure teams generally balance three approaches:
- Full Packet Inspection (Raw PCAP): Tools like
tcpdumpand Zeek capture entire frames, including payloads, protocol headers, and TCP control flags. The detail is unmatched. However, a single 10 Gbps link running at 70% capacity generates roughly 75 TB of uncompressed PCAP data every 24 hours. Storing and analyzing raw PCAPs at that volume requires dedicated capture appliances and massive NVMe arrays, making multi-week retention prohibitively expensive. - SNMP Polling: Polling interface counters every 1 to 5 minutes gives you basic link saturation numbers. It is lightweight and easy to configure. Yet SNMP remains a total black box. If an uplink suddenly hits 98% utilization at 2:00 AM, SNMP cannot tell you which internal IP, remote host, or application protocol caused the spike.
- Flow Accounting (NetFlow, sFlow, IPFIX): Edge routers and switches export compact metadata records summarizing each connection. These records track source and destination IPs, port numbers, protocol flags, packet counts, and byte tallies. Flow accounting cuts your data footprint by more than 99% compared to full PCAP. The same 10 Gbps link compresses down to roughly 1 GB to 2 GB of structured flow data per day, giving you rich visibility without the storage tax.
The open-source pmacct toolset solves the collection puzzle on Linux. Built around specialized daemons—nfacctd for NetFlow and IPFIX, sfacctd for sFlow, and pmacctd for raw interfaces—it ingests incoming UDP datagrams, collapses flows in memory, and writes structured records directly into PostgreSQL, ClickHouse, or Kafka.
Architecture Trade-offs: When pmacct Fits
Before rolling pmacct into production, weigh its architectural strengths against its operational limits:
Advantages
- Protocol Flexibility: The suite ingests legacy NetFlow v5 from older Cisco Catalysts, NetFlow v9, IPFIX from modern Junos and VyOS routers, and sampled sFlow v5 frames from Arista switches.
- In-Memory Aggregation: High-traffic backbones easily generate 100,000 raw flow exports per second. If you inserted each record straight into SQL, your database would stall under write amplification. pmacct groups matching flows inside an internal cache during a configurable aggregation window (such as 5 minutes), flushing only pre-aggregated summaries into your database.
- Direct Database Support: You do not need secondary log forwarders or custom Python glue scripts. Native C plugins stream records directly into PostgreSQL, MySQL, ClickHouse, SQLite, and Apache Kafka.
- BGP Enrichment: By establishing a read-only BGP peering session with your upstream transit routers,
nfacctdmaps live AS-paths and BGP communities directly onto flow records as packets arrive.
Limitations
- No Payload Visibility: Flows track layer-3 and layer-4 metadata only. You cannot inspect HTTP request bodies, TLS handshake parameters, or raw DNS query strings.
- Sampling Blindspots: On 40 Gbps and 100 Gbps backbones, switches often use 1:1,000 or 1:4,096 hardware packet sampling. Short single-packet probes and micro-bursts lasting only a few milliseconds can slip by undetected unless your team accounts for statistical normalization.
- Table Growth: At 5-minute intervals across hundreds of subnets, a relational database like PostgreSQL still receives millions of rows per week. You must budget time for index maintenance and partition pruning.
Recommended Architecture
A battle-tested flow pipeline needs to survive sudden traffic bursts without dropping UDP datagrams. The following setup handles up to 50 Gbps of monitored transit across multiple edge devices:
- Collector:
nfacctdrunning on Ubuntu 22.04/24.04 LTS, listening for NetFlow v9 and IPFIX traffic on UDP port 2055. - Storage Engine: PostgreSQL 15 or 16 with daily table partitioning. Partitioning prevents bloated B-tree indexes and lets you drop aged data in milliseconds with
DROP TABLEinstead of heavyDELETEsweeps. - Aggregation Interval: 300 seconds (5 minutes). This balance preserves actionable forensic resolution while keeping database insert rates under control.
- Retention Policy: Automated table rotation using
pg_partman, purging partitions older than 30 to 60 days to protect disk capacity.
Step-by-Step Implementation: nfacctd to PostgreSQL
The following deployment configures nfacctd to collect flow telemetry from your network hardware and flush aggregated tables into a local PostgreSQL instance.
Step 1: Install Required Packages
Install PostgreSQL, the database development libraries, and the pmacct suite from the official Ubuntu repositories. The stock Ubuntu package includes the PostgreSQL dynamic backend plugin compiled in.
sudo apt update
sudo apt install -y pmacct postgresql postgresql-contrib
Verify that the binary runs properly and check which plugins are compiled in:
nfacctd -V
sudo systemctl status postgresql --no-pager
Step 2: Tune Linux UDP Socket Buffers
Flow collection daemons process intense bursts of UDP datagrams. If the Linux network stack runs out of socket buffer space, the kernel silently drops incoming flows. Raise the maximum receive buffer sizes before starting the daemon:
sudo sysctl -w net.core.rmem_max=33554432
sudo sysctl -w net.core.rmem_default=8388608
echo "net.core.rmem_max=33554432" | sudo tee -a /etc/sysctl.d/99-pmacct.conf
echo "net.core.rmem_default=8388608" | sudo tee -a /etc/sysctl.d/99-pmacct.conf
Step 3: Create the PostgreSQL Database and Schema
Create a dedicated PostgreSQL user and database for pmacct. We will build a table that records source, destination, layer-4 ports, protocol, byte totals, and timestamps.
sudo -u postgres psqlRun these SQL statements inside the prompt:
CREATE USER pmacct WITH PASSWORD 'StrongPmacctSecretKey';
CREATE DATABASE pmacct_db OWNER pmacct;
\c pmacct_db pmacct;

CREATE TABLE acct_v9 (
    agent_id VARCHAR(16) NOT NULL DEFAULT '0',
    as_src INT NOT NULL DEFAULT 0,
    as_dst INT NOT NULL DEFAULT 0,
    ip_src INET NOT NULL,
    ip_dst INET NOT NULL,
    src_port INT NOT NULL DEFAULT 0,
    dst_port INT NOT NULL DEFAULT 0,
    ip_proto SMALLINT NOT NULL DEFAULT 0,
    packets BIGINT NOT NULL,
    bytes BIGINT NOT NULL,
    stamp_inserted TIMESTAMP WITHOUT TIME ZONE NOT NULL DEFAULT NOW(),
    stamp_updated TIMESTAMP WITHOUT TIME ZONE DEFAULT NULL,
    PRIMARY KEY (agent_id, ip_src, ip_dst, src_port, dst_port, ip_proto, stamp_inserted)
);

CREATE INDEX idx_acct_v9_stamps ON acct_v9 (stamp_inserted);
CREATE INDEX idx_acct_v9_dst_lookup ON acct_v9 (ip_dst, stamp_inserted);
\q
Step 4: Configure nfacctd
Create your collector configuration file at /etc/pmacct/nfacctd.conf. This setup binds to port 2055, caches incoming connections into 5-minute aggregation buckets, and streams the finished blocks into PostgreSQL via bulk COPY.
sudo mkdir -p /etc/pmacct
sudo nano /etc/pmacct/nfacctd.conf
Save the following configuration:
! /etc/pmacct/nfacctd.conf - Flow Accounting Daemon Configuration

! Process control
daemonize: false
pidfile: /run/nfacctd.pid
syslog: daemon

! Socket and buffer settings
nfacctd_ip: 0.0.0.0
nfacctd_port: 2055
nfacctd_time_new: true
plugin_buffer_size: 10240
plugin_pipe_size: 10240000

! Output backend
plugins: pgsql[traffic_in]

! Aggregation primitives: group active flows by these dimensions
aggregate[traffic_in]: src_host, dst_host, src_port, dst_port, proto

! Database target parameters
sql_db[traffic_in]: pmacct_db
sql_table[traffic_in]: acct_v9
sql_user[traffic_in]: pmacct
sql_passwd[traffic_in]: StrongPmacctSecretKey
sql_host[traffic_in]: 127.0.0.1

! Timing and bulk write performance
sql_refresh_time[traffic_in]: 300
sql_history[traffic_in]: 5m
sql_history_roundoff[traffic_in]: m
sql_dont_try_update[traffic_in]: true
sql_use_copy[traffic_in]: true
Using sql_use_copy: true instructs pmacct to batch rows using PostgreSQL's binary bulk-copy interface instead of dispatching individual INSERT statements. This reduces disk I/O and keeps ingestion latency under 20 milliseconds during heavy traffic.
Step 5: Create the Systemd Service
Wrap nfacctd in a systemd service unit so the collector restarts automatically after kernel reboots or system crashes.
sudo nano /etc/systemd/system/nfacctd.servicePaste the unit file definition:
[Unit]
Description=pmacct NetFlow/IPFIX Collector
After=network.target postgresql.service
Wants=postgresql.service

[Service]
Type=simple
ExecStart=/usr/sbin/nfacctd -f /etc/pmacct/nfacctd.conf
Restart=always
RestartSec=5s
LimitNOFILE=65536

[Install]
WantedBy=multi-user.target
Reload the systemd manager, activate the service, and inspect its runtime status:
sudo systemctl daemon-reload
sudo systemctl enable --now nfacctd
sudo systemctl status nfacctd
Confirm that the collector is listening on UDP port 2055:
sudo ss -ulnp 'sport = :2055'Step 6: Query and Analyze Traffic Data
Configure your border routers or switches to export flows toward your Linux collector's IP address on UDP 2055. Allow five minutes for the first cache bucket to fill and flush. Then open the PostgreSQL shell to analyze your traffic patterns:
psql -U pmacct -d pmacct_db -h 127.0.0.1Find the top 5 internal hosts receiving the heaviest inbound volume over the last 60 minutes:
SELECT
    ip_dst AS destination_ip,
    CASE ip_proto
        WHEN 6 THEN 'TCP'
        WHEN 17 THEN 'UDP'
        WHEN 1 THEN 'ICMP'
        ELSE 'Other'
    END AS protocol,
    SUM(packets) AS total_packets,
    ROUND(SUM(bytes)::numeric / (1024 * 1024), 2) AS total_mb
FROM
    acct_v9
WHERE
    stamp_inserted > NOW() - INTERVAL '1 hour'
GROUP BY
    ip_dst, ip_proto
ORDER BY
    total_mb DESC
LIMIT 5;
Identify which service destination ports generate the most throughput during that same timeframe:
SELECT
    dst_port,
    CASE ip_proto
        WHEN 6 THEN 'TCP'
        WHEN 17 THEN 'UDP'
        ELSE 'Other'
    END AS transport,
    ROUND(SUM(bytes)::numeric / (1024 * 1024), 2) AS mb_consumed
FROM
    acct_v9
WHERE
    stamp_inserted > NOW() - INTERVAL '1 hour'
GROUP BY
    dst_port, ip_proto
ORDER BY
    mb_consumed DESC
LIMIT 10;
Your Linux host is now a high-performance flow collector. From here, connect Grafana using the official PostgreSQL data source to chart real-time bandwidth trends, spot DDoS attacks early, and forecast uplink capacity needs across your infrastructure.