
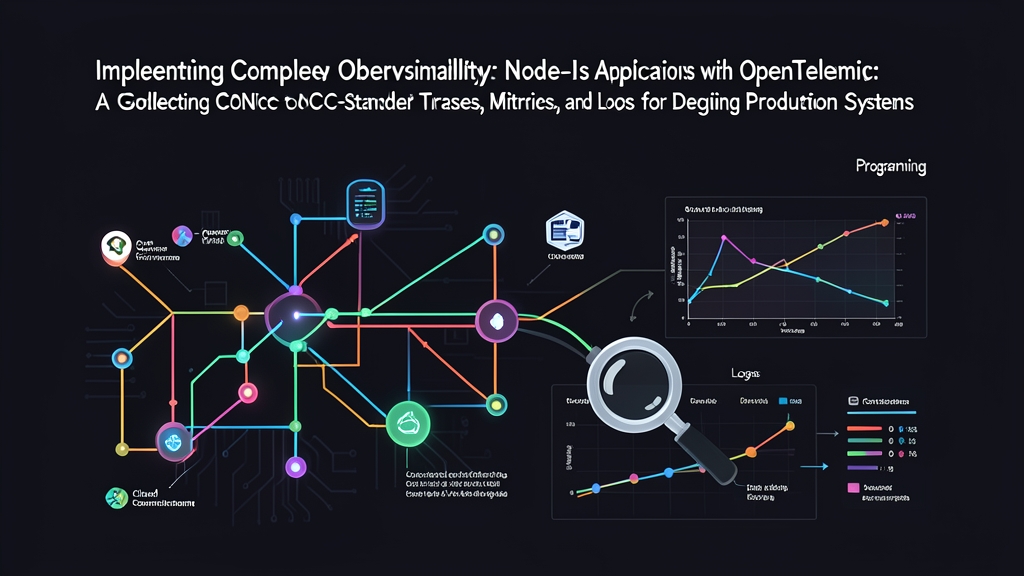
Context: Surviving Production Outages with OpenTelemetry
Debugging Node.js on localhost is straightforward. Production under load is another story. When your checkout endpoint’s p99 latency spikes from 45ms to 4.2 seconds during a flash sale, standard console.log output turns into a wall of unreadable text. Timestamps drift across asynchronous callbacks. You find yourself guessing: did a Postgres query stall on an unindexed table, did Stripe’s webhook timeout, or did a 12MB JSON payload block the single-threaded event loop?
OpenTelemetry (OTel) eliminates that guesswork. Backed by the Cloud Native Computing Foundation (CNCF), it delivers a vendor-neutral standard for telemetry. Instead of trapping your codebase inside a proprietary APM agent, OTel standardizes how you emit three fundamental telemetry signals:
- Traces: Follow an HTTP request across functions, microservices, and databases using injected trace and span IDs.
- Metrics: Numeric aggregations (request throughput, GC pause duration, event loop lag) computed over rolling intervals.
- Logs: Structured events tied directly to active trace IDs so you can isolate error context in seconds.
Correlating these three signals turns midnight firefighting into a 30-second root-cause lookup.
Installation: Adding the OpenTelemetry Node.js SDK
OTel uses a modular architecture. You install only the components your application requires. Here is how to set up an Express service with automatic instrumentation and OpenTelemetry Protocol (OTLP) exporters:
mkdir node-otel-demo
cd node-otel-demo
npm init -y

# Install Express and the OpenTelemetry API
npm install express @opentelemetry/api

# Install SDK runtime, auto-instrumentations, and OTLP exporters
npm install @opentelemetry/sdk-node \
  @opentelemetry/auto-instrumentations-node \
  @opentelemetry/sdk-metrics \
  @opentelemetry/resources \
  @opentelemetry/semantic-conventions \
  @opentelemetry/exporter-trace-otlp-proto \
  @opentelemetry/exporter-metrics-otlp-proto
Here is what each component handles:
@opentelemetry/api: The API package providing tracing and context functions for your application code.@opentelemetry/sdk-node: The runtime engine that initializes tracer providers, metric readers, and background exporters before your app starts.@opentelemetry/auto-instrumentations-node: Community-maintained hooks that wrap modules likehttp,express,pg,ioredis, andmongodbautomatically.@opentelemetry/exporter-*-otlp-proto: High-performance protobuf exporters that transmit telemetry over HTTP/gRPC to collectors such as Grafana Tempo, Jaeger, or SigNoz.
Configuration: Instrumenting Node.js Cleanly
Initialization order matters. OpenTelemetry must patch core Node.js modules before your application loads dependencies. If Express or pg imports ahead of OTel, outbound network sockets and route handlers run uninstrumented.
Step 1: Create the Instrumentation Module
Create an instrumentation.js file in your project root. Keep this logic separate from your web server bootstrap.
// instrumentation.js
const { NodeSDK } = require('@opentelemetry/sdk-node');
const { getNodeAutoInstrumentations } = require('@opentelemetry/auto-instrumentations-node');
const { OTLPTraceExporter } = require('@opentelemetry/exporter-trace-otlp-proto');
const { PeriodicExportingMetricReader, ConsoleMetricExporter } = require('@opentelemetry/sdk-metrics');
const { Resource } = require('@opentelemetry/resources');
const { SemanticResourceAttributes } = require('@opentelemetry/semantic-conventions');

const traceExporter = new OTLPTraceExporter({
  url: process.env.OTEL_EXPORTER_OTLP_TRACES_ENDPOINT || 'http://localhost:4318/v1/traces',
});

const metricReader = new PeriodicExportingMetricReader({
  exporter: new ConsoleMetricExporter(),
  exportIntervalMillis: 15000,
});

const sdk = new NodeSDK({
  resource: new Resource({
    [SemanticResourceAttributes.SERVICE_NAME]: 'order-api-service',
    [SemanticResourceAttributes.SERVICE_VERSION]: '1.2.0',
    [SemanticResourceAttributes.DEPLOYMENT_ENVIRONMENT]: process.env.NODE_ENV || 'production',
  }),
  traceExporter,
  metricReader,
  instrumentations: [getNodeAutoInstrumentations()],
});

sdk.start();

// Flush remaining spans during process termination
const shutdown = () => {
  sdk.shutdown()
    .then(() => console.log('[OTel] SDK shutdown complete'))
    .catch((err) => console.error('[OTel] Error shutting down SDK', err))
    .finally(() => process.exit(0));
};

process.on('SIGTERM', shutdown);
process.on('SIGINT', shutdown);
Step 2: Build the Sample Application with Trace-Correlated Logs
Create app.js. We will create custom spans around critical business logic and inject trace metadata into our JSON log payloads.
// app.js
const express = require('express');
const opentelemetry = require('@opentelemetry/api');

const app = express();
const PORT = process.env.PORT || 3000;

// Correlate stdout logs with active spans
function logWithTrace(level, message, data = {}) {
  const activeSpan = opentelemetry.trace.getActiveSpan();
  const spanContext = activeSpan ? activeSpan.spanContext() : null;

  const payload = {
    timestamp: new Date().toISOString(),
    level,
    message,
    trace_id: spanContext ? spanContext.traceId : 'none',
    span_id: spanContext ? spanContext.spanId : 'none',
    ...data,
  };
  console.log(JSON.stringify(payload));
}

app.get('/api/orders/:id', async (req, res) => {
  const orderId = req.params.id;
  const tracer = opentelemetry.trace.getTracer('order-tracer');

  // Create an explicit child span for granular timing
  return tracer.startActiveSpan('process-order-logic', async (span) => {
    try {
      span.setAttribute('app.order.id', orderId);
      logWithTrace('info', 'Processing order request', { orderId });

      // Simulate a 120ms database query
      await new Promise((resolve) => setTimeout(resolve, 120));

      if (orderId === 'invalid') {
        throw new Error('Order lookup failed: record 0x404 missing in primary replica');
      }

      span.setStatus({ code: opentelemetry.SpanStatusCode.OK });
      res.status(200).json({ status: 'success', orderId, totalCents: 4999 });
    } catch (err) {
      span.recordException(err);
      span.setStatus({
        code: opentelemetry.SpanStatusCode.ERROR,
        message: err.message,
      });
      logWithTrace('error', err.message, { orderId });
      res.status(404).json({ error: err.message });
    } finally {
      span.end();
    }
  });
});

app.listen(PORT, () => {
  console.log(`Server listening on port ${PORT}`);
});
Verification & Production Deployment
Preload your instrumentation file using Node’s native --require flag before starting the main process. This ensures telemetry hooks attach before Express initializes.
node --require ./instrumentation.js app.js1. Trigger Test Requests
Send two sample requests to inspect how OTel handles healthy vs. failing code paths:
# 1. Successful request (generates OK span and standard 200 HTTP trace)
curl -i http://localhost:3000/api/orders/order_8829

# 2. Failing request (records an exception and sets span status to ERROR)
curl -i http://localhost:3000/api/orders/invalid
2. Trace-to-Log Correlation in Action
Review the application’s stdout. The log formatter outputs structured JSON records containing matching W3C trace_id and span_id values:
{"timestamp":"2026-11-16T11:50:00.123Z","level":"error","message":"Order lookup failed: record 0x404 missing in primary replica","trace_id":"4bf92f3577b34da6a3ce929d0e0e4736","span_id":"00f067aa0ba902b7","orderId":"invalid"}When PagerDuty pings you at 2:00 AM, query your log aggregator (such as Loki, Datadog, or Elasticsearch) for the error message. Grab the trace_id and paste it into Jaeger or Grafana Tempo. Immediately, you see the full waterfall: exactly 120ms spent waiting on the database before the error surfaced.
3. Next Production Steps
- Decouple with an OTel Collector: Avoid sending telemetry directly from production Node.js instances to third-party endpoints. Deploy the OpenTelemetry Collector as a Kubernetes sidecar or local daemonset. It batches spans (e.g., 512-record buffers), compresses payloads, and reduces networking overhead on Node’s event loop.
- Configure head-based sampling: At 10,000 requests per second, capturing 100% of traces wastes storage and money. Set
OTEL_TRACES_SAMPLER=parentbased_traceidratiowith anOTEL_TRACES_SAMPLER_ARG=0.05ratio to record 5% of healthy traffic while capturing 100% of exceptions. - Use standard environment variables: Never bake collector endpoints into code. Set
OTEL_EXPORTER_OTLP_ENDPOINT=http://otel-collector:4318andOTEL_SERVICE_NAME=order-apithrough your deployment manifests.