Approach Comparison: Traditional Packet Sniffing vs. eBPF-Powered Observability
It is 2:14 AM on a Tuesday. PagerDuty sounds: our checkout service is throwing intermittent 504 Gateway Timeouts, and downstream payment requests are failing fast. You hop onto a bastion host, run kubectl get pods, and find every container healthy. The application logs reveal almost nothing beyond cryptic connection resets. You are flying blind inside your own cluster network.
When packets vanish into the Kubernetes virtual networking fabric, engineers usually fall back on three fragmented tactics:
- Ephemeral debug containers with tcpdump: You attach a debug container to the target pod’s network namespace or run
nsenterdirectly on the node to capture raw PCAP files. While accurate, this is painfully slow during an outage. Dumping 50,000 packets a second can spike node CPU by 20% to 30%, and it floods your terminal with hex dumps stripped of pod names, service targets, and Kubernetes namespaces. - Service Mesh sidecars (Envoy / Istio): Application-layer proxies handle HTTP traffic well, but they cannot show you what happens beneath Layer 7. If an iptables rule or an underlying CNI silently discards SYN packets, your sidecar proxy reports only an opaque upstream timeout. On top of that, proxy injection adds 80MB to 150MB of memory bloat per pod alongside a 1ms to 3ms round-trip latency hit.
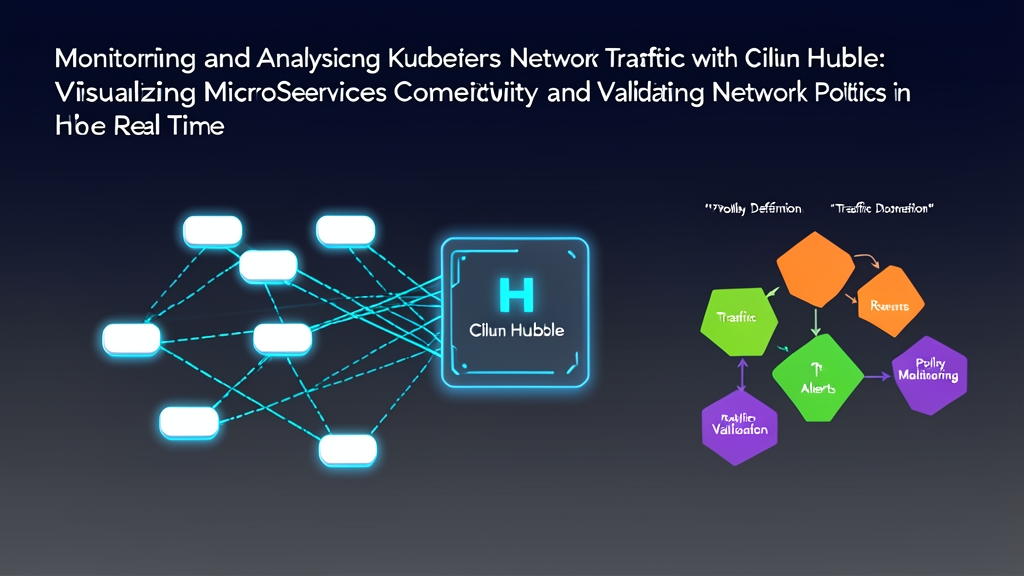
- Kernel-level eBPF with Cilium Hubble: Rather than injecting proxies into pods or sifting through raw bytes after an incident spiraled, Cilium attaches Extended Berkeley Packet Filter (eBPF) programs directly to Linux kernel hooks. Hubble rides on top of this engine, inspecting flows at the socket and packet layers. Handshakes, DNS lookups, HTTP transactions, and dropped packets are mapped to Kubernetes metadata—source pod, target service, labels, and namespaces—before they ever reach user space.
Pros & Cons of Network Observability Strategies
Picking an inspection method comes down to balancing runtime overhead, operational safety, and contextual clarity when production is down.
1. The Legacy Toolbox (tcpdump, iptables logging, conntrack)
- Pros: Pre-installed on almost every Linux distribution; zero cluster-wide architectural churn.
- Cons: Carries a serious risk of saturating busy nodes during capture; strips out workload metadata; fails to track ephemeral pod IPs that churn during rolling updates.
2. Layer 7 Service Mesh Proxies
- Pros: Rich HTTP/gRPC tracing; granular golden signals (latency, error rate); transparent mutual TLS (mTLS).
- Cons: Heavy resource footprint (often over 100MB RAM per workload replica); blind to non-TCP traffic and low-level kernel drops; brittle injection and upgrade lifecycles.
3. Cilium with Hubble
- Pros: Negligible kernel-level capture overhead; native L3/L4/L7 visibility without sidecars; dynamic mapping of raw flows to Kubernetes labels; instant feedback on blocked packets against active
CiliumNetworkPolicyrules. - Cons: Requires modern Linux kernels (Linux 5.4 or newer; Linux 5.10+ recommended); requires deploying Cilium as your primary CNI or running it chained on top of an existing provider.
Recommended Setup: The Resilient eBPF Observability Stack
During an active incident, logging agents that choke on high traffic are worse than useless. Cilium prevents this bottleneck by decoupling in-kernel packet inspection from user-space data aggregation:
- Cilium Agent (DaemonSet): Loads eBPF bytecode into node network interfaces, such as veth pairs and physical NICs. It pushes flow metadata to per-CPU ring buffers directly inside kernel space.
- Hubble Server (embedded in Cilium Agent): Retains recent flows in an in-memory 4,096-entry ring buffer on each node. This localized storage prevents your network from saturating when high-volume traffic spikes occur.
- Hubble Relay: A lightweight centralized deployment that connects to the local gRPC socket on each node, rolling up cluster-wide flows into a single queryable endpoint.
- Hubble CLI & UI: The operators’ control deck. The CLI provides immediate, stream-oriented filtering right in your terminal, while the UI generates live service dependency graphs and visually highlights drops.
Implementation Guide: From Zero to Real-Time Flow Inspection
When services fail silently, tracing packet flows at the kernel layer within seconds makes the difference between a ten-minute triage and a six-hour post-mortem.
Step 1: Install Cilium with Hubble and Relay Enabled
Deploy or upgrade Cilium with its official Helm chart, making sure to explicitly enable Hubble Relay, the web UI, and core metric monitors:
helm repo add cilium https://helm.cilium.io/
helm repo update

helm upgrade --install cilium cilium/cilium \
  --namespace kube-system \
  --set hubble.enabled=true \
  --set hubble.relay.enabled=true \
  --set hubble.ui.enabled=true \
  --set hubble.metrics.enabled="{dns,drop,tcp,flow,port-distribution,icmp,http}"
Check the rollout status across your cluster:
kubectl rollout status daemonset/cilium -n kube-system
kubectl rollout status deployment/hubble-relay -n kube-system
kubectl rollout status deployment/hubble-ui -n kube-system
Step 2: Install and Connect the Hubble CLI
The web dashboard helps with high-level architecture reviews. For live firefighting, though, the standalone CLI is your sharpest tool. Pull the official client binary:
export HUBBLE_VERSION=$(curl -s https://raw.githubusercontent.com/cilium/hubble/master/stable.txt)
curl -L --fail --remote-name "https://github.com/cilium/hubble/releases/download/${HUBBLE_VERSION}/hubble-linux-amd64.tar.gz"
tar xzvf hubble-linux-amd64.tar.gz
sudo mv hubble /usr/local/bin/
rm hubble-linux-amd64.tar.gz
Next, forward Hubble Relay’s port in the background:
cilium hubble port-forward &Verify that your local CLI can communicate with the cluster:
hubble statusThe command will report that Hubble Relay is healthy and linked to 100% of your nodes (for instance, Connected Nodes: 12/12).
Step 3: Hunt Down Dropped Traffic in Real Time
Back to our 2:14 AM incident: the checkout pod cannot reach the payment API. Forget grep-ing through logs—let’s stream all cluster-wide packet drops live:
hubble observe --verdict DROPPED --followIs your terminal scrolling too fast? Scope the query down to the production namespace and the payment deployment:
hubble observe \
  --namespace production \
  --to-label app=payment \
  --verdict DROPPED \
  -o compact
Within seconds, eBPF logs the drop event alongside the exact kernel reason:
TIMESTAMP             SOURCE                                 DESTINATION                         TYPE             VERDICT
Nov 07 02:18:41.102   production/checkout-6d48b99-xk92w:42180   production/payment-574b6df-j9xkp:8080   Policy denied    DROPPED (Policy denied (Ingress))
There is your culprit. An active ingress policy blocked the packet right at the payment container’s virtual interface. No guesswork, no packet captures, no blind restart cycles.
Step 4: Inspect and Fix the Mismatched Network Policy
Let’s inspect the active policies on the payment service:
kubectl get ciliumnetworkpolicies -n production -o yamlNotice the problem? The policy expects incoming traffic from pods labeled tier: frontend. However, the last deployment pipeline updated checkout’s selector to app: checkout without modifying the network rules. Let’s fix this with an explicit CiliumNetworkPolicy:
apiVersion: "cilium.io/v2"
kind: CiliumNetworkPolicy
metadata:
  name: allow-checkout-to-payment
  namespace: production
spec:
  endpointSelector:
    matchLabels:
      app: payment
  ingress:
  - fromEndpoints:
    - matchLabels:
      app: checkout
    toPorts:
    - ports:
      - port: "8080"
        protocol: TCP
Apply the corrected policy:
kubectl apply -f allow-checkout-to-payment.yamlStep 5: Validate Policy Resolution and Monitor Layer 7 Flows
Leave your terminal feed open. Less than a second after applying the manifest, the drop events cease and packets flip from DROPPED to FORWARDED:
hubble observe \
  --namespace production \
  --from-pod checkout \
  --to-pod payment \
  --protocol tcp \
  --follow
Want to verify the application layer too? Pass the --protocol http flag to inspect HTTP status codes and wire latency:
hubble observe \
  --namespace production \
  --to-label app=payment \
  --protocol http \
  -o dict
You can now see HTTP POST /charge requests returning 200 OK within 12ms. The outage is resolved, confirmed by kernel telemetry, and documented with hard data before the on-call channel finishes waking up.