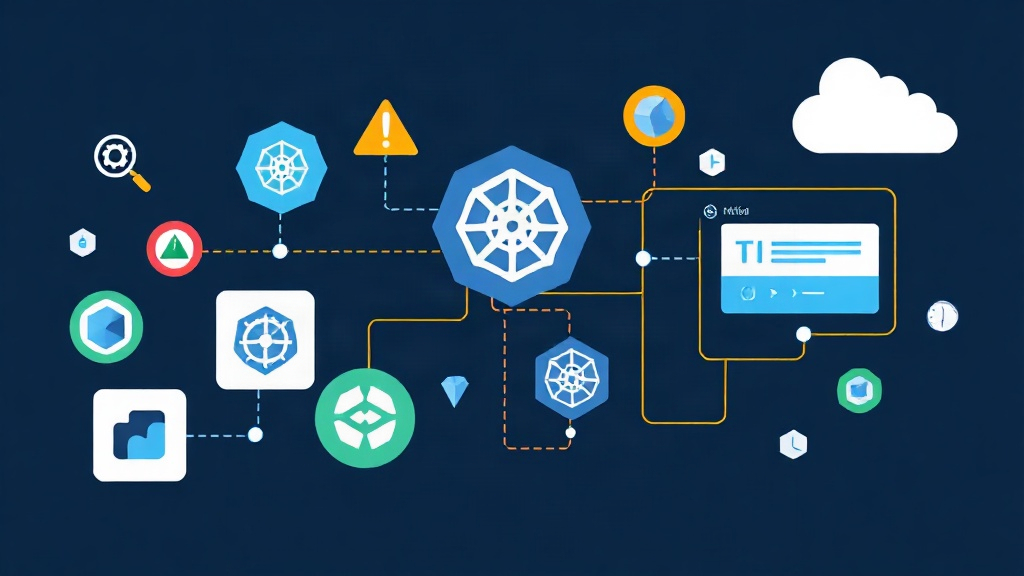
The Real Problem with Production Deployments
Every Friday release used to bring that familiar knot in my stomach. Standard rolling updates sound great in theory, but they fall short during silent failures. You roll out version 2.0, pods pass their basic readiness probes, and Kubernetes immediately routes 100% of user traffic to them. Then the 500 errors start rolling in.
Staging rarely catches edge-case bugs. A memory leak in our order-processing worker once stayed hidden until hit by 800 concurrent requests in production. Within four minutes, 30% of active checkouts dropped before anyone noticed the alert. That disaster forced us to adopt Progressive Delivery using Flagger and Istio, removing manual traffic management entirely.
Instead of exposing every user to unverified code, you route a tiny slice of live traffic—say, 5%—to the new version. You observe real telemetry for error spikes or latency regressions. If the canary stays healthy, you incrementally widen the pipe. If errors appear, the system rolls back instantly without human intervention.
How the Components Fit Together
Progressive Delivery vs. Standard Rollouts
Progressive Delivery couples gradual traffic shifting with automated analysis loops. A standard rolling update stops only if a container crashes or fails an HTTP health check. In contrast, progressive rollouts query live application metrics like HTTP error rates and P99 latency before shifting each additional batch of users.
Flagger: The Automation Controller
Flagger is a Kubernetes operator that manages the canary lifecycle from start to finish. When you bump a Deployment’s container image, Flagger intercepts the release, builds an isolated canary replica set, and kicks off an evaluation loop:
- Routes an initial 5%–10% of traffic to the canary deployment.
- Queries Prometheus every 60 seconds against configured SLO thresholds.
- Increases traffic weight after every successful evaluation window.
- Reverts routing to the stable primary pods if error thresholds are exceeded.
Istio: The Service Mesh Data Plane
Standard Kubernetes ClusterIP Services distribute traffic randomly across matching pod labels. They cannot split traffic 90/10 by percentage. Istio solves this at Layer 7 using VirtualService and DestinationRule resources. Flagger manipulates these Istio routing rules dynamically, so engineers never have to tweak routing weights by hand.
Setting Up the Stack
Prerequisites
You need a Kubernetes cluster running version 1.24 or higher, kubectl access, and helm v3 installed. You also need Prometheus collecting mesh telemetry, which comes out of the box with the standard kube-prometheus-stack chart.
Install Istio
curl -L https://istio.io/downloadIstio | ISTIO_VERSION=1.20.0 sh -
cd istio-1.20.0
export PATH=$PWD/bin:$PATH

istioctl install --set profile=default -y

# Enable automatic Envoy sidecar injection on the target namespace
kubectl label namespace default istio-injection=enabled --overwrite
Install Flagger
helm repo add flagger https://flagger.app
helm repo update

helm upgrade -i flagger flagger/flagger \
  --namespace=istio-system \
  --set meshProvider=istio \
  --set metricsServer=http://kube-prometheus-stack-prometheus.monitoring:9090
Point metricsServer directly to your cluster’s Prometheus endpoint. Flagger queries this address during every analysis interval to evaluate canary health.
Configuring an Automated Canary
Base Deployment and Service
Deploy your application using a standard Deployment manifest. Flagger clones this resource into my-app-primary (the stable baseline) and manages the canary instances for you.
apiVersion: apps/v1
kind: Deployment
metadata:
  name: my-app
  namespace: default
spec:
  replicas: 2
  selector:
    matchLabels:
      app: my-app
  template:
    metadata:
      labels:
        app: my-app
    spec:
      containers:
      - name: my-app
        image: my-registry/my-app:1.0.0
        ports:
        - containerPort: 8080
        resources:
          requests:
            cpu: 100m
            memory: 128Mi
          limits:
            cpu: 500m
            memory: 512Mi
---
apiVersion: v1
kind: Service
metadata:
  name: my-app
  namespace: default
spec:
  selector:
    app: my-app
  ports:
  - port: 80
    targetPort: 8080
Canary Custom Resource
The Canary custom resource controls the progression rules, traffic increments, and rollback criteria:
apiVersion: flagger.app/v1beta1
kind: Canary
metadata:
  name: my-app
  namespace: default
spec:
  targetRef:
    apiVersion: apps/v1
    kind: Deployment
    name: my-app
  progressDeadlineSeconds: 120
  service:
    port: 80
    targetPort: 8080
    gateways:
    - istio-system/ingressgateway
    hosts:
    - my-app.example.com
  analysis:
    interval: 1m
    threshold: 5
    maxWeight: 50
    stepWeight: 10
    metrics:
    - name: request-success-rate
      thresholdRange:
        min: 99
      interval: 1m
    - name: request-duration
      thresholdRange:
        max: 500
      interval: 1m
Key configuration details:
- interval (1m): Flagger collects and evaluates metrics once every minute.
- threshold (5): Five consecutive metric check failures trigger an immediate rollback.
- maxWeight (50): Canary traffic peaks at 50% before full promotion to primary.
- stepWeight (10): Each successful check increases traffic by 10% (10%, 20%, 30%, 40%, 50%).
- request-success-rate: Requires an HTTP success rate of at least 99% based on Envoy telemetry.
- request-duration: P99 latency must remain under 500ms.
Triggering a Rollout
Apply your Canary manifest and wait for Flagger to initialize. Once the primary deployment is ready, update the container image to launch a release:
kubectl set image deployment/my-app \
  my-app=my-registry/my-app:2.0.0 \
  -n default
Monitor progress in your terminal:
kubectl get canary my-app -n default -w

# NAME     STATUS        WEIGHT   LASTTRANSITIONTIME
# my-app   Progressing   10       2024-01-15T10:00:00Z
# my-app   Progressing   20       2024-01-15T10:01:00Z
# my-app   Progressing   30       2024-01-15T10:02:00Z
# my-app   Progressing   40       2024-01-15T10:03:00Z
# my-app   Progressing   50       2024-01-15T10:04:00Z
# my-app   Promoting     0        2024-01-15T10:05:00Z
# my-app   Succeeded     0        2024-01-15T10:06:00Z
Testing the Rollback Mechanism
Never trust a rollback policy you haven’t intentionally broken. Deploy an image version configured to return 500 errors on 10% of requests, then stream Flagger’s controller logs:
kubectl logs -n istio-system \
  -l app.kubernetes.io/name=flagger \
  --tail=100 -f | grep my-app
As errors hit Prometheus, Flagger catches the breach and halts progression:
Halt my-app.default advancement: request-success-rate 94.20 < 99
Halt my-app.default advancement: request-success-rate 93.80 < 99
Rolling back my-app.default: failed checks threshold reached (5/5)
Canary failed! Scaling down my-app.canary
Istio immediately resets traffic routing to 100% on my-app-primary. The faulty release affected only 10% of users during a 5-minute window instead of knocking down the entire cluster.
Writing Custom Business Metric Gates
HTTP status codes do not tell the whole story. You can gate deployments on application-specific Prometheus metrics, such as checkout failures or database query latencies, using a MetricTemplate:
apiVersion: flagger.app/v1beta1
kind: MetricTemplate
metadata:
  name: checkout-error-rate
  namespace: default
spec:
  provider:
    type: prometheus
    address: http://kube-prometheus-stack-prometheus.monitoring:9090
  query: |
    sum(rate(http_requests_total{
      app="my-app",
      path="/checkout",
      status=~"5.."
    }[1m]))
    /
    sum(rate(http_requests_total{
      app="my-app",
      path="/checkout"
    }[1m])) * 100
Attach the metric template to your Canary definition:
  analysis:
    metrics:
    - name: checkout-error-rate
      templateRef:
        name: checkout-error-rate
        namespace: default
      thresholdRange:
        max: 0.5
      interval: 1m
If checkout failures exceed 0.5% during any step, Flagger freezes the release immediately.
Production Field Notes
Align your Prometheus scrape configs with Flagger’s analysis cadence. If Prometheus scrapes every 30 seconds, a 1-minute Flagger interval ensures at least two fresh metric data points per evaluation. A 60-second scrape on a 60-second check risks querying stale calculations.
Low-traffic microservices need synthetic traffic generation. If your service handles fewer than 10 requests per second, Flagger metrics can fluctuate wildly. Use Flagger’s built-in webhooks feature to spin up load-testing tools like ghz or hey against the canary pod during analysis.
Teams that prefer all-or-nothing cutovers can still run blue-green releases. Set stepWeight: 100 in your Canary spec. Flagger will run health evaluations against the isolated candidate before flipping all traffic over at once.
Automating canary analysis removes guesswork from the deployment pipeline. Define your reliability criteria up front in code, let Istio handle routing weights, and let Flagger manage the rollbacks.