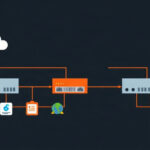
Network Traffic Monitoring: Approach Comparison
Standard interface counters and SNMP graphs show how much bandwidth you use, but they never show what is using it. When an upstream pipe chokes at 2:00 AM, engineering teams typically rely on one of three visibility strategies:
- Layer 3/4 Flow Analyzers (NetFlow / sFlow / IPFIX): Great for core routers handling 40Gbps+ links. Routers sample packet headers (often 1 in 1,000 packets) and summarize connections by IP addresses and ports. The problem? Port numbers no longer tell the truth. A rogue 80GB backup job, a Zoom video call, and legitimate database replication can all run over port 443. Flow samples treat them as identical.
- Raw Packet Capture (tcpdump / Wireshark): Captures every single byte crossing the wire. It is the gold standard for dissecting subtle protocol bugs. However, capturing a saturated 1Gbps uplink generates roughly 450GB of raw PCAP data every hour. Storing, indexing, and querying that volume quickly becomes impractical during live incident response.
- Real-Time Deep Packet Inspection (ntopng + nDPI): Combines the speed of flow tracking with protocol inspection. By analyzing just the first 10 to 15 packets of each session, the embedded nDPI library inspects TLS SNI headers, DNS queries, and HTTP metadata. It categorizes traffic without saving full payloads, keeping CPU and disk usage under control.
Pros and Cons of Layer 7 DPI with ntopng
Every monitoring architecture involves trade-offs. Here is what to weigh before rolling ntopng into your environment.
The Advantages
- Accurate Protocol Detection: Identifies traffic by behavior and handshake metadata rather than port numbers. It reliably flags BitTorrent, Zoom, GitHub API calls, and wireline database traffic even when obscured behind standard ports.
- Live TCP Health Metrics: Tracks round-trip time (RTT), packet retransmissions, and out-of-order packets per host in real time.
- Minimal Disk I/O: Avoids writing massive PCAP files to disk. Active flow state lives in memory and local Redis keys, writing only lightweight aggregates for long-term trends.
- Agentless Monitoring: Operates entirely out-of-band using a network TAP or switch mirror (SPAN) port. You never need to touch or install agents on production servers.
The Drawbacks
- Memory Sizing Requirements: Stateful tracking demands dedicated RAM. Plan for roughly 1GB to 2GB of memory per 100,000 active concurrent flows. If a sudden SYN flood fills the state table, ntopng will drop new flow records.
- Kernel Overhead on Fast Links: Standard Linux socket capture starts dropping packets once traffic exceeds 3Gbps to 5Gbps. Saturated 10Gbps+ uplinks require zero-copy kernel bypass drivers like PF_RING ZC or AF_XDP.
- No Payload Decryption: nDPI parses initial handshakes, cipher negotiations, and domain names from TLS Client Hellos. It cannot inspect encrypted request bodies or encrypted application data.
Recommended Production Architecture
A dedicated tapping instance gives you immediate answers during bandwidth incidents without overwhelming your team with raw dump files.
For reliable capture on a 1Gbps to 10Gbps link, set up a dedicated Linux server with two physical network interfaces:
eth0: The management interface. Assign an isolated internal IP address for SSH access and the web UI.eth1: The dedicated capture interface. Run this in promiscuous mode with no IP address assigned, connected directly to a network TAP or switch SPAN port.- Redis: Bound locally to
127.0.0.1:6379to maintain fast in-memory flow counters and host tables.
Step-by-Step Implementation Guide
This deployment guide targets Ubuntu 22.04 and Debian 12 LTS using official ntop repository builds for up-to-date protocol signatures.
Step 1: Install Redis and Base Dependencies
Install the prerequisite packages and start Redis:
sudo apt update && sudo apt install -y software-properties-common wget curl lsb-release gnupg redis-server

# Enable and verify Redis
sudo systemctl enable --now redis-server
sudo redis-cli ping
# Expected output: PONG
Add the official ntop repository package:
# Download and install repository definition
wget https://packages.ntop.org/apt/22.04/all/apt-ntop.deb
sudo dpkg -i apt-ntop.deb

# Refresh repository metadata
sudo apt update
Step 2: Install ntopng and nDPI
Install ntopng along with the nDPI protocol library and optional PF_RING kernel module support:
sudo apt install -y ntopng pfring-dkmsStep 3: Configure ntopng
ntopng reads startup flags from /etc/ntopng/ntopng.conf. Open the configuration file:
sudo nano /etc/ntopng/ntopng.confReplace the file contents with the configuration below. Update eth1 to match your capture interface and adjust the subnet CIDRs to match your environment:
# Process daemon PID file
-G=/var/run/ntopng.pid

# HTTP listening port
-w=3000

# Dedicated capture interface (promiscuous, no IP)
-i=eth1

# Local subnet definitions for inside vs. outside traffic routing
-m=192.168.1.0/24,10.0.0.0/8

# Redis instance endpoint
-r=127.0.0.1:6379

# Disable active DNS resolution to reduce CPU load under heavy traffic
-n=1

# Community license mode
--community
Step 4: Configure the Capture Interface
The monitoring interface must operate in promiscuous mode to capture frames not addressed directly to its MAC address:
sudo ip link set dev eth1 promisc on
sudo ip link set dev eth1 up
Create a systemd unit to keep promiscuous mode active across reboots:
sudo tee /etc/systemd/system/promisc-interface.service << 'EOF'
[Unit]
Description=Enable Promiscuous Mode on Capture Interface
After=network.target

[Service]
Type=oneshot
ExecStart=/sbin/ip link set dev eth1 promisc on
RemainAfterExit=yes

[Install]
WantedBy=multi-user.target
EOF

sudo systemctl daemon-reload
sudo systemctl enable promisc-interface.service
Step 5: Start ntopng and Log In
Start the service and monitor the systemd journal for initialization errors:
sudo systemctl restart ntopng
sudo systemctl enable ntopng
sudo journalctl -u ntopng -f
Point your browser to http://<server-management-ip>:3000.
- Default username:
admin - Default password:
admin
ntopng will immediately prompt you to replace the default password before granting access to the dashboard.
Step 6: Practical Troubleshooting Workflows
Once traffic reaches the capture interface, focus on these views to diagnose operational problems:
- Pinpoint Heavy Bandwidth Consumers: Navigate to Flows > Active Flows. Sort by Throughput. Check the Application column to see whether a surge represents database sync traffic (
PostgreSQL), bulk cloud storage transfers (AmazonAWS.S3), or background system upgrades. - Diagnose Packet Loss and Network Lag: Go to Hosts > Local Hosts, select a busy server, and open TCP / Metrics. TCP retransmission rates above 1.5% or client-to-server RTT values exceeding 100ms often indicate bad patch cables, duplex mismatches, or congested switch buffers.
- Catch Suspicious Outbound Activity: Open the Alerts panel to inspect real-time security warnings. Look for abnormal spikes in DNS queries per second, unexpected outbound SSH connections from web servers, or anomalous TLS handshakes pointing to untrusted IP blocks.