The 2 AM Network Nightmare
It was 2:14 AM on a Tuesday when a core switch in our primary data center began dropping roughly 15% of its packets. My monitor was a sea of red alerts, but the ‘why’ remained hidden.
Within ten minutes, I had 12 SSH terminals open, frantically tailing logs on Cisco Nexus switches, Juniper edge routers, and a pair of FortiGate 600F firewalls. Correlating a timestamp from a firewall ‘deny’ event with a spanning-tree shift on a switch felt like trying to solve a puzzle while the pieces were melting. Two hours of downtime passed before I manually grepped enough text files to find the loop.
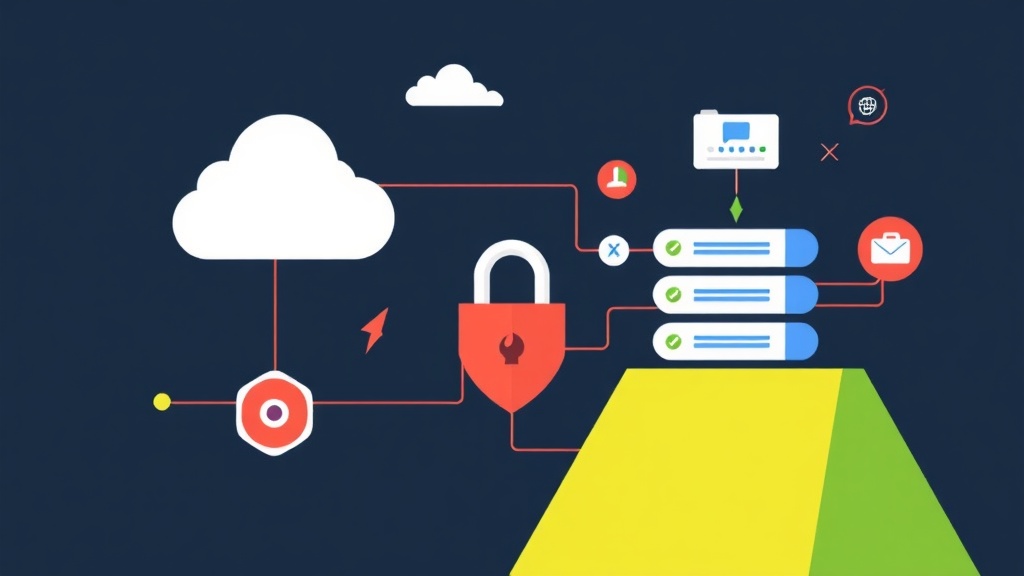
This is the tax you pay for decentralized logging. When your data lives in isolated silos, you aren’t just slow—you’re flying blind. Transitioning from reactive firefighting to proactive infrastructure management requires one specific move: centralizing every byte of telemetry your hardware generates.
Why Decentralized Logs Fail
The problem isn’t just where the logs live; it’s that they are ephemeral. Network devices have notoriously small circular buffers for storage. On a busy 10Gbps link, a switch might overwrite its logs every 30 minutes. If you aren’t looking at the ‘smoking gun’ immediately, it’s gone forever.
Inconsistent formatting adds another layer of friction. A Cisco IOS log shares almost no DNA with a Palo Alto traffic log or a Linux iptables entry. Without a way to normalize these into a single searchable schema, cross-device correlation is impossible. You cannot simply ask, “Which devices did IP 10.0.5.42 touch in the last five minutes?” without logging into every single hop in the path.
The Comparison: Grep vs. Splunk vs. ELK
I evaluated three distinct paths to solve this:
- The Manual Way (Grep/Rsyslog): You send everything to a central Linux box via Syslog. It’s free and fast to start, but searching through 100GB of raw text files is agonizingly slow. You get zero visualization and no automated alerts.
- The Enterprise Way (Splunk): It’s the gold standard for a reason—fast, polished, and powerful. However, the licensing model is volume-based. For a network generating 50GB of firewall logs daily, your annual license cost could easily eclipse your hardware budget.
- The Engineering Way (ELK Stack): Elasticsearch, Logstash, and Kibana. This setup provides the power of a professional SIEM with open-source flexibility. You own the data, you control the parsing, and you can scale the cluster as your traffic grows.
For most teams, ELK is the sweet spot. It provides high-end visibility without the ‘bill shock’ of proprietary tools.
Building the ELK Pipeline
A successful logging strategy isn’t just about storage; it’s about transformation. We need a pipeline that ingests, parses, indexes, and visualizes. Here is the architecture I use for production environments.
1. Tuning Elasticsearch
Elasticsearch is the engine. For a medium network, a single node works, but you must prioritize memory. In a Linux environment, go to /etc/elasticsearch/jvm.options to set the heap size. Aim for 50% of your system RAM, capped at 31GB to keep compressed pointers efficient:
# For an 8GB RAM VM, allocate 4GB to the heap
-Xms4g
-Xmx4g
2. Logstash: The Data Translator
Logstash is where the ‘magic’ happens. It listens for incoming Syslog traffic (UDP/514), breaks messy strings into clean fields like src_ip and action, and ships them to Elasticsearch. Create /etc/logstash/conf.d/network-logs.conf:
input {
  syslog {
    port => 514
    type => "syslog"
  }
}

filter {
  if [type] == "syslog" {
    # Parse specific Cisco formats using Grok patterns
    grok {
      match => { "message" => "%{CISCOFW1}" }
    }
    # Map the geographic origin of external IPs
    geoip {
      source => "src_ip"
    }
  }
}

output {
  elasticsearch {
    hosts => ["localhost:9200"]
    index => "network-logs-%{+YYYY.MM.dd}"
  }
}
I highly recommend the geoip filter. Seeing a heat map of blocked connection attempts is far more useful for a security briefing than a list of raw Chinese or Russian IP addresses.
3. Pointing Your Hardware
Configuring your devices is the final step. On a Cisco switch, the command is simple:
logging host 192.168.1.100 transport udp port 514
logging trap informational
For a FortiGate firewall, use the CLI for granular control:
config log syslogd setting
    set status enable
    set server "192.168.1.100"
    set mode udp
    set port 514
end
Visualizing with Kibana
With data flowing, Kibana becomes your cockpit. Instead of grepping, you build dashboards that answer critical questions instantly:
- Top Blocked Sources: Which specific IPs are hammering your edge?
- Traffic Spikes: Is there a 300% surge in internal traffic? That might be a broadcast storm or a ransomware sync.
- Audit Trails: Exactly what commands did an admin run on the core switch at 3:00 PM?
The true ROI appears in the “Discover” tab. When a user reports a ‘slow connection,’ you can filter by their IP across every switch, router, and firewall simultaneously. You’ll see the packet hit the core, pass the router, and perhaps get dropped by the edge firewall—all in one unified timeline.
Final Thoughts
Setting up ELK requires an initial investment of time and hardware. However, the first time you solve a complex routing loop in three minutes instead of three hours, the system pays for itself. Start small. Index your edge firewalls first, then add your core switches. Total visibility isn’t a luxury anymore; for a modern engineer, it’s the only way to survive.